
animate_decay
衰变
这个例子展示了:
- 使用生成器来驱动动画,
- 在动画期间更改轴限制。

1 | import numpy as np |
下载这个示例
本博客所有文章除特别声明外,均采用 CC BY-NC-SA 4.0 许可协议。转载请注明来源 Estom的博客!
相关推荐

2020-09-26
accented_text
在matplotlib中使用重音文本Matplotlib通过tex、mathtext或unicode支持重音字符。 使用mathtext,提供以下重音:hat,breve,grave,bar,acute,tilde,vec,dot,ddot。所有这些语法都具有相同的语法,例如,要创建一个overbar,你可以使用 bar{o} 或者使用 o 元音来执行 ddot{o}。 还提供了快捷方式,例如: “o ‘e `e ~n .x ^y 12345678910111213141516171819202122import matplotlib.pyplot as plt# Mathtext demofig, ax = plt.subplots()ax.plot(range(10))ax.set_title(r'$\ddot{o}\acute{e}\grave{e}\hat{O}' r'\breve{i}\bar{A...

2021-12-24
pvcreate
pvcreate将物理硬盘分区初始化为物理卷 补充说明pvcreate命令 用于将物理硬盘分区初始化为物理卷,以便LVM使用。 语法1pvcreate(选项)(参数) 选项1234-f:强制创建物理卷,不需要用户确认;-u:指定设备的UUID;-y:所有的问题都回答“yes”;-Z:是否利用前4个扇区。 参数物理卷:指定要创建的物理卷对应的设备文件名。 实例查看磁盘信息: 123456789101112131415[root@localhost ~]# fdisk -lDisk /dev/hda: 41.1 GB, 41174138880 bytes255 heads, 63 sectors/track, 5005 cylindersUnits = cylinders of 16065 * 512 = 8225280 bytes Device Boot Start End Blocks id System/dev/hda1 * 1 13 104391 83 Linux/de...
2021-03-20
30
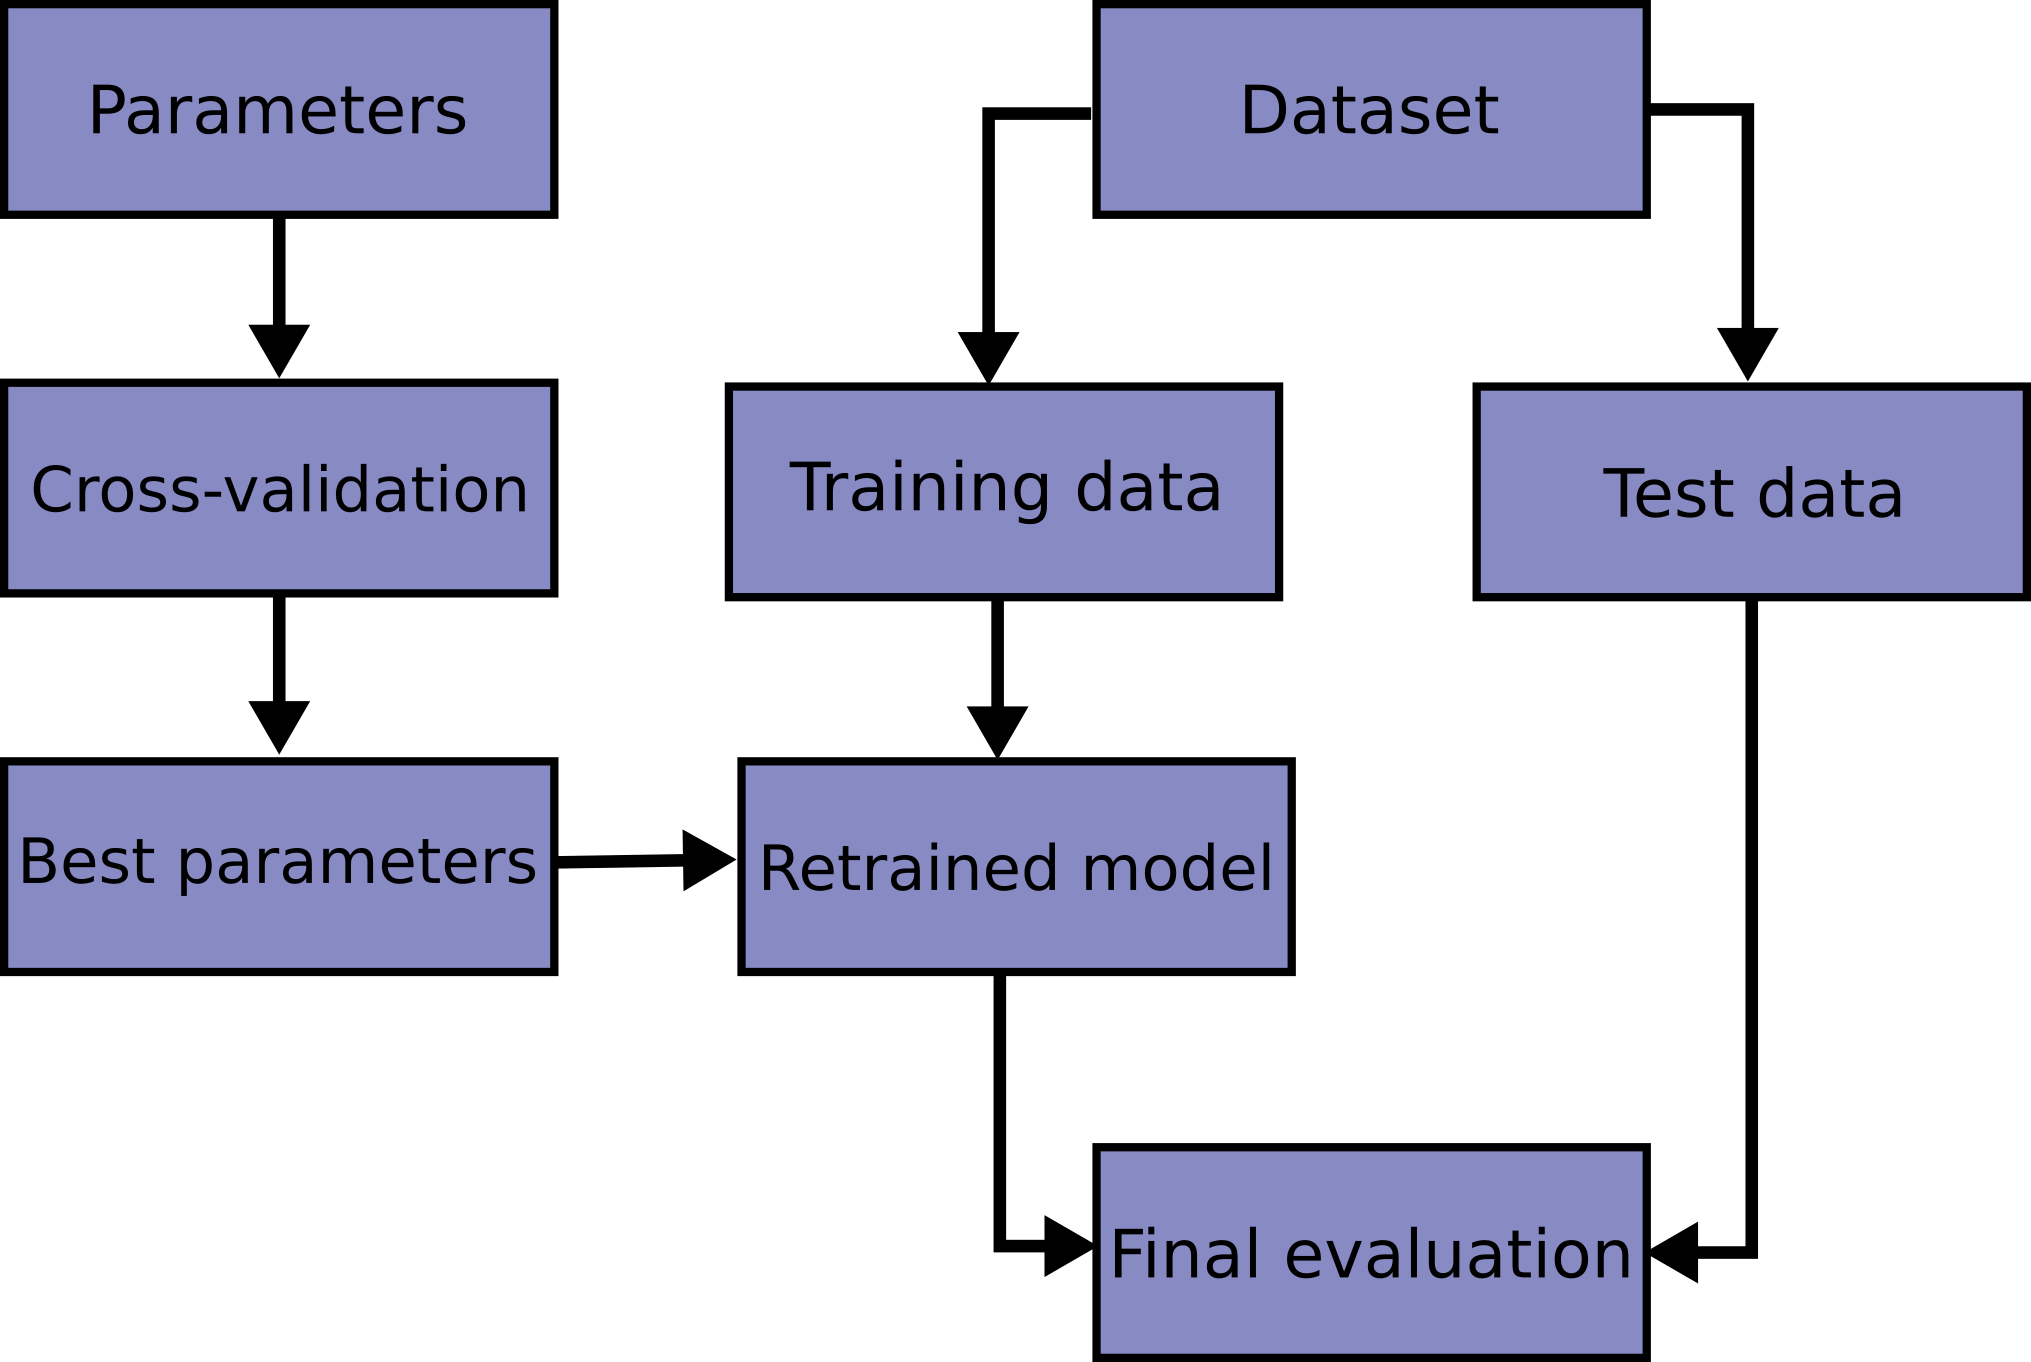
3.1. 交叉验证:评估估算器的表现校验者: @想和太阳肩并肩 @樊雯 @Loopy翻译者: @\S^R^Y/ 学习预测函数的参数,并在相同数据集上进行测试是一种错误的做法: 一个仅给出测试用例标签的模型将会获得极高的分数,但对于尚未出现过的数据它则无法预测出任何有用的信息。 这种情况称为 overfitting(过拟合). 为了避免这种情况,在进行(监督)机器学习实验时,通常取出部分可利用数据作为 test set(测试数据集) X_test, y_test。需要强调的是这里说的 “experiment(实验)” 并不仅限于学术(academic),因为即使是在商业场景下机器学习也往往是从实验开始的。下面是模型训练中典型的交叉验证工作流流程图。通过网格搜索可以确定最佳参数。 利用 scikit-learn 包中的 train_test_split 辅助函数可以很快地将实验数据集划分为任何训练集(training sets)和测试集(test sets)。 下面让我们载入 iris 数据集,并在此数据集上训练出线...

2020-09-26
patch_collection
圆,楔和多边形此示例演示如何使用修补程序集合。 12345678910111213141516171819202122232425262728293031323334353637383940414243444546474849import numpy as npfrom matplotlib.patches import Circle, Wedge, Polygonfrom matplotlib.collections import PatchCollectionimport matplotlib.pyplot as plt# Fixing random state for reproducibilitynp.random.seed(19680801)fig, ax = plt.subplots()resolution = 50 # the number of verticesN = 3x = np.random.rand(N)y = np.random.rand(N)radii = 0.1*np.random.rand(N)patches = []for x1, y1, r ...

2020-09-26
demo_bboximage
BboxImage 演示BboxImage可用于根据边界框定位图像。此演示演示如何在text.Text的边界框内显示图像以及如何手动为图像创建边界框。 12345678910111213141516171819202122232425262728293031323334353637383940414243444546474849505152535455565758596061import matplotlib.pyplot as pltimport numpy as npfrom matplotlib.image import BboxImagefrom matplotlib.transforms import Bbox, TransformedBboxfig, (ax1, ax2) = plt.subplots(ncols=2)# ----------------------------# Create a BboxImage with Text# ----------------------------txt = ax1.text(0.5, 0.5, "test&q...

2023-08-15
04-4.StatefulSet
在 Kubernetes 1.7 及之后的版本中,可以为 StatefulSet 设定 .spec.updateStrategy 字段,以便您可以在改变 StatefulSet 中 Pod 的某些字段时(container/labels/resource request/resource limit/annotation等)禁用滚动更新。 On DeleteOnDelete 策略实现了 StatefulSet 的遗留版本(kuberentes 1.6及以前的版本)的行为。如果 StatefulSet 的 .spec.updateStrategy.type 字段被设置为 OnDelete,当您修改 .spec.template 的内容时,StatefulSet Controller 将不会自动更新其 Pod。您必须手工删除 Pod,此时 StatefulSet Controller 在重新创建 Pod 时,使用修改过的 .spec.template 的内容创建新 Pod。 Rolling Updates.spec.updateStrategy...


