
demo_axes_divider
演示Axes Divider
轴分割器用于计算轴的位置,并使用现有轴实例为它们创建分隔线。

1 | import matplotlib.pyplot as plt |
下载这个示例
本博客所有文章除特别声明外,均采用 CC BY-NC-SA 4.0 许可协议。转载请注明来源 Estom的博客!
相关推荐

2020-09-26
fig_axes_customize_simple
简单的图轴自定义自定义简单绘图的背景,标签和刻度。 1import matplotlib.pyplot as plt 用 plt.figure 创建一个 matplotlib.figure.Figure 实例 12345678910111213141516171819202122fig = plt.figure()rect = fig.patch # a rectangle instancerect.set_facecolor('lightgoldenrodyellow')ax1 = fig.add_axes([0.1, 0.3, 0.4, 0.4])rect = ax1.patchrect.set_facecolor('lightslategray')for label in ax1.xaxis.get_ticklabels(): # label is a Text instance label.set_color('red') label.set_rotation(45) label.set...
2021-03-20
51
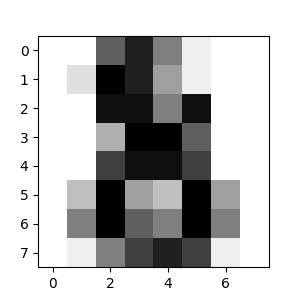
使用 scikit-learn 介绍机器学习校验者: @小瑶 @hlxstc @BWM-蜜蜂 @小瑶 @Loopy翻译者: @李昊伟 @… 内容提要 在本节中,我们介绍一些在使用 scikit-learn 过程中用到的 机器学习 词汇,并且给出一些示例阐释它们。 机器学习:问题设置一般来说,一个学习问题通常会考虑一系列 n 个 样本 数据,然后尝试预测未知数据的属性。 如果每个样本是 多个属性的数据 (比如说是一个多维记录),就说它有许多“属性”,或称 features(特征) 。 我们可以将学习问题分为几大类: 监督学习 , 其中数据带有一个附加属性,即我们想要预测的结果值( 点击此处 转到 scikit-learn 监督学习页面)。这个问题可以是: 分类 : 样本属于两个或更多个类,我们想从已经标记的数据中学习如何预测未标记数据的类别。 分类问题的一个示例是手写数字识别,其目的是将每个输入向量分配给有限数目的离散类别之一。 我们通常把分类视作监督学习的一个离散形式(区别于连续...

2020-09-26
line_with_text
艺术家中的艺术家重写基本方法,以便一个艺术家对象可以包含另一个艺术家对象。在这种情况下,该行包含一个文本实例来为其添加标签。 1234567891011121314151617181920212223242526272829303132333435363738394041424344454647484950515253545556import numpy as npimport matplotlib.pyplot as pltimport matplotlib.lines as linesimport matplotlib.transforms as mtransformsimport matplotlib.text as mtextclass MyLine(lines.Line2D): def __init__(self, *args, **kwargs): # we'll update the position when the line data is set self.text = mtext.Text(0, 0, '...
2021-03-20
7
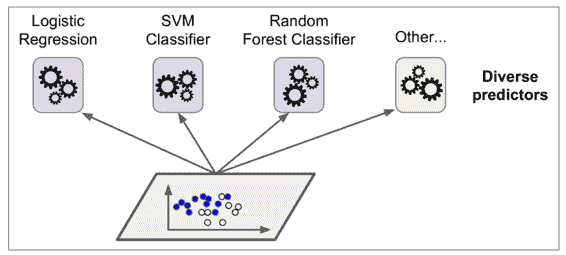
七、集成学习和随机森林 译者:@friedhelm739 校对者:@飞龙、@PeterHo、@yanmengk、@XinQiu、@YuWang 假设你去随机问很多人一个很复杂的问题,然后把它们的答案合并起来。通常情况下你会发现这个合并的答案比一个专家的答案要好。这就叫做群体智慧。同样的,如果你合并了一组分类器的预测(像分类或者回归),你也会得到一个比单一分类器更好的预测结果。这一组分类器就叫做集成;因此,这个技术就叫做集成学习,一个集成学习算法就叫做集成方法。 例如,你可以训练一组决策树分类器,每一个都在一个随机的训练集上。为了去做预测,你必须得到所有单一树的预测值,然后通过投票(例如第六章的练习)来预测类别。例如一种决策树的集成就叫做随机森林,它除了简单之外也是现今存在的最强大的机器学习算法之一。 向我们在第二章讨论的一样,我们会在一个项目快结束的时候使用集成算法,一旦你建立了一些好的分类器,就把他们合并为一个更好的分类器。事实上,在机器学习竞赛中获得胜利的算法经常会包含一些集成方法。 在本章中我们会讨论一下特别著名的集成方法,包括 bagging, boosting, s...

2021-12-24
get_module
get_module获取Linux内核模块的详细信息 补充说明get_module命令 用于获取Linux内核模块的详细信息。 语法1get_module 模块名 实例使用lsmod命令查看内核模块: 123456lsmod | head -5Module Size Used byipv6 272801 15xfrm_nalgo 13381 1 ipv6crypto_api 12609 1 xfrm_nalgoip_conntrack_ftp 11569 0 使用get_module命令查看模块详细信息: 1234567891011121314151617181920212223242526272829303132get_module ipv6 refcnt : 15 srcversion : 8CC9C024755B4483E56C0EFParameters: ...
2022-07-11
10 Java泛型
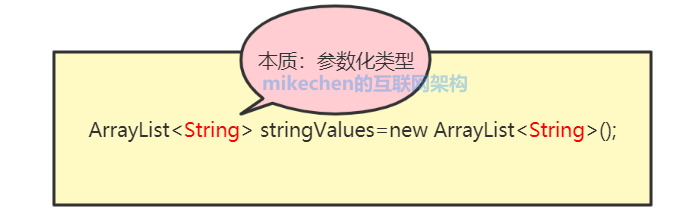
泛型机制 1 泛型概述 基本概念 泛型的基本用法 2 优势 安全性 消除强制转换 避免了不必要的装箱、拆箱操作,提高程序的性能 提高了代码的重用行 3 泛型的使用 泛型类 泛型接口 泛型方法 4 泛型通配符 5 泛型中的 KTVE 6 泛型的实现原理 7 泛型与反射 反射 8 泛型最佳实践 8.1 父类泛型化(模板基类) 8.2 子类保留泛型(继续向下传递) 8.3 父类想“知道子类类型”:CRTP(自引用泛型) 9 复杂问题 复杂问题 1 类型安全地组合“处理器/策略/管道” 定义泛型接口 组合(关键:通配符) 复杂问题 2:泛型 + 继承做“注册表/工厂/插件” Key 用 Class<T>(类型令牌) 复杂问题 3:泛型集合 API 设计(复制、merge、填充) 复制:经典 copy merge:K/V 继承关系更复杂 复杂问题 4:构建泛型数据库框架 复杂问题 5:构建泛型缓存框架 复杂问题 6:构建泛型事件系统 复杂问题 7:根据请求值类型定位返回值类型 9 常见坑与建...


