
inset_locator_demo2
插入定位器演示2
本演示展示了如何通过 zoomed_inset_axes 创建缩放插图。 在第一个子图中,AnchoredSizeBar 显示缩放效果。 在第二个子图中,通过mark_inset 创建与感兴趣区域的连接。

1 | import matplotlib.pyplot as plt |
下载这个示例
本博客所有文章除特别声明外,均采用 CC BY-NC-SA 4.0 许可协议。转载请注明来源 Estom的博客!
相关推荐

2021-03-20
39
5.2. 特征提取校验者: @if only翻译者: @片刻 模块 sklearn.feature_extraction 可用于提取符合机器学习算法支持的特征,比如文本和图片。 注意特征特征提取与特征选择有很大的不同:前者包括将任意数据(如文本或图像)转换为可用于机器学习的数值特征。后者是将这些特征应用到机器学习中。 5.2.1. 从字典类型加载特征类 DictVectorizer 可用于将标准的Python字典(dict)对象列表的要素数组转换为 scikit-learn 估计器使用的 NumPy/SciPy 表示形式。 虽然 Python 的处理速度不是特别快,但 Python 的 dict 优点是使用方便,稀疏(不需要存储的特征),并且除了值之外还存储特征名称。 类 DictVectorizer 实现了 “one-of-K” 或 “one-hot” 编码,用于分类(也称为标称,离散)特征。分类功能是 “属性值” 对,其中该值被限制为不排序的可能性的离散列表(例如主题标识符,对象类型,标签,名称…)。 在下面的示例,”城市” 是一个分...

2020-09-26
joinstyle
连接图样式举例说明三种不同的连接样式。 123456789101112131415161718192021222324import numpy as npimport matplotlib.pyplot as pltdef plot_angle(ax, x, y, angle, style): phi = np.radians(angle) xx = [x + .5, x, x + .5*np.cos(phi)] yy = [y, y, y + .5*np.sin(phi)] ax.plot(xx, yy, lw=8, color='blue', solid_joinstyle=style) ax.plot(xx[1:], yy[1:], lw=1, color='black') ax.plot(xx[1::-1], yy[1::-1], lw=1, color='black') ax.plot(xx[1:2], yy[1:2], 'o', color=&#x...

2020-09-26
close_event
关闭事件显示图形关闭时发生的连接事件的示例。 1234567891011import matplotlib.pyplot as pltdef handle_close(evt): print('Closed Figure!')fig = plt.figure()fig.canvas.mpl_connect('close_event', handle_close)plt.text(0.35, 0.5, 'Close Me!', dict(size=30))plt.show() 下载这个示例 下载python源码: close_event.py 下载Jupyter notebook: close_event.ipynb

2023-11-26
04 事务操作
1 事务操作数据库事务介绍事务:一组逻辑操作单元,使数据从一种状态变换到另一种状态。 事务处理(事务操作): 保证所有事务都作为一个工作单元来执行,即使出现了故障,都不能改变这种执行方式。当在一个事务中执行多个操作时,要么所有的事务都 被提交(commit),那么这些修改就永久地保存下来;要么数据库管理系统将放弃所作的所有修改,整个事务 回滚(rollback) 到最初状态。 为确保数据库中数据的一致性,数据的操纵应当是离散的成组的逻辑单元:当它全部完成时,数据的一致性可以保持,而当这个单元中的一部分操作失败,整个事务应全部视为错误,所有从起始点以后的操作应全部回退到开始状态。 JDBC 事务处理数据一旦提交,就不可回滚。 数据什么时候意味着提交? 当一个连接对象被创建时,默认情况下是自动提交事务:每次执行一个 SQL 语句时,如果执行成功,就会向数据库自动提交,而不能回滚。关闭数据库连接,数据就会自动的提交。 如果多个操作,每个操作使用的是自己单独的连接,则无法保证事务。即同一个事务的多个操作必须在同一个连接下。JDBC 程序中为了让多个 SQL 语句作为一个事务执行: 调用 ...
2019-11-03
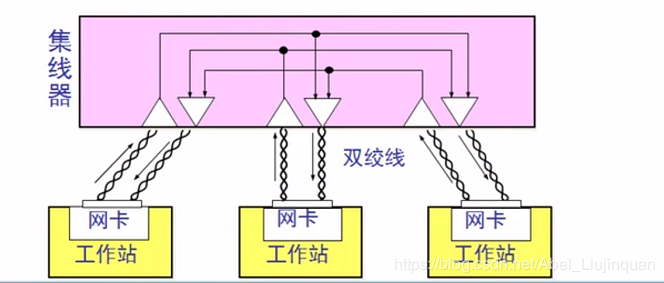
Ethernet
Ethernet 以太网不是网络的统称,是一种是先局域网的方式。 1 计算机网络网络结点分布 局域网(Local Area Network,LAN)是一种在小范围内实现的计算机网络,一般在一个建筑物内,或一个工厂、一个事业单位内部,为单位独有。局域网距离可在十几公里以内,信道传输速率可达1~20Mbps,结构简单,布线容易。 广域网(Wide Area Network,WAN)范围很广,可以分布在一个省内、一个国家或几个国家。广域网信道传输速率较低,一般小于0.1Mbps,结构比较复杂。 城域网(Metropolitan Area Network,MAN)是在一个城市内部组建的计算机信息网络,提供全市的信息服务。目前,我国许多城市正在建设城域网。 交换方式 线路交换(Circurt Switching)最早出现在电话系统中,早期的计算机网络就是采用此方式来传输数据的,数字信号经过变换成为模拟信号后才能在线路上传输。 报文交换(Message Switching)是一种数字化网络。当通信开始时,源机发出的一个报文被存储在交换器里,交换器根据报文的目的地址选择合适的路径发...
2021-10-14
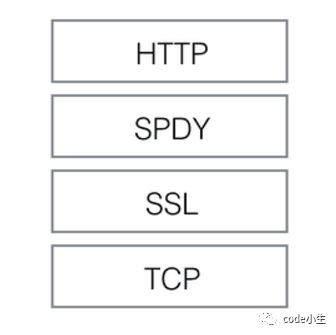
2.7 应用层-HTTP2.0
0 概述HTTP 2.0是在SPDY(An experimental protocol for a faster web, The Chromium Projects)基础上形成的下一代互联网通信协议。HTTP/2 的目的是通过支持请求与响应的多路复用来较少延迟,通过压缩HTTPS首部字段将协议开销降低,同时增加请求优先级和服务器端推送的支持。 2012年google如一声惊雷提出了SPDY的方案,优化了HTTP1.X的请求延迟,解决了HTTP1.X的安全性,具体如下: 降低延迟,针对HTTP高延迟的问题,SPDY优雅的采取了多路复用(multiplexing)。多路复用通过多个请求stream共享一个tcp连接的方式,解决了HOL blocking的问题,降低了延迟同时提高了带宽的利用率。 请求优先级(request prioritization)。多路复用带来一个新的问题是,在连接共享的基础之上有可能会导致关键请求被阻塞。SPDY允许给每个request设置优先级,这样重要的请求就会优先得到响应。比如浏览器加载首页,首页的html内容应该优先展示,之后才是各种静态...


