
simple_anchored_artists
简单锚定艺术家对象示例
此示例说明如何使用在 offsetbox 和 Matplotlib axes_grid1 Toolkit 中找到的锚定辅助对象类。类似图形的实现,但不使用工具包,可以在锚定的艺术家对象中找到。

1 | import matplotlib.pyplot as plt |
下载这个示例
本博客所有文章除特别声明外,均采用 CC BY-NC-SA 4.0 许可协议。转载请注明来源 Estom的博客!
相关推荐
2021-03-09
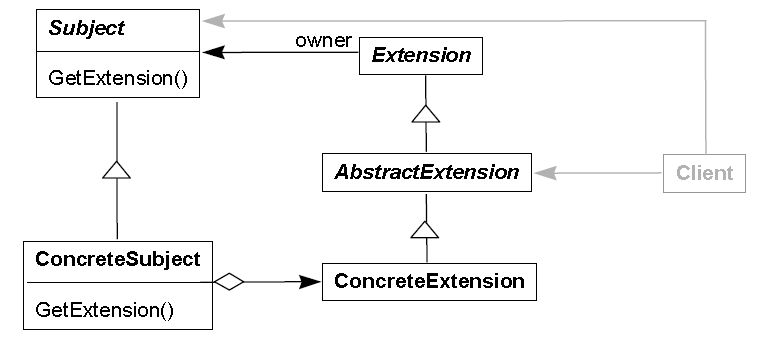
5.2 Extension Object(扩展对象)
索引 意图 结构 参与者 适用性 效果 相关模式 实现 实现方式(一):使用示例结构实现 Extension Object。 实现方式(二):使用泛型实现 IExtensibleObject<T> 接口。 意图 预期对象的接口将在未来被扩展。通过额外的接口来定义扩展对象。 Anticipate that an object’s interface needs to be extended in the future. Additional interfaces are defined by extension objects.. 结构 参与者 Subject 定义抽象主体对象。其定义用于查询是否包含特定扩展的接口。 Extension 所有扩展类的抽象基类。可以定义负责管理扩展自身的操作。 Extension 知道其是谁的扩展。 ConcreteSubject 具体的主体类。实现基类定义的 GetExtension 方法并返回相应的扩展对象。 AbstractExtension 特定种类的扩展类的抽象基类。 Concre...

2022-12-05
07.深克隆和浅克隆有什么区别?它的实现方式有哪些?
深克隆和浅克隆有什么区别?它的实现方式有哪些?使用克隆可以为我们快速地构建出一个已有对象的副本,它属于 Java 基础的一部分,也是面试中常被问到的知识点之一。 我们本课时的面试题是,什么是浅克隆和深克隆?如何实现克隆? 典型回答浅克隆(Shadow Clone)是把原型对象中成员变量为值类型的属性都复制给克隆对象,把原型对象中成员变量为引用类型的引用地址也复制给克隆对象,也就是原型对象中如果有成员变量为引用对象,则此引用对象的地址是共享给原型对象和克隆对象的。 简单来说就是浅克隆只会复制原型对象,但不会复制它所引用的对象,如下图所示: 深克隆(Deep Clone)是将原型对象中的所有类型,无论是值类型还是引用类型,都复制一份给克隆对象,也就是说深克隆会把原型对象和原型对象所引用的对象,都复制一份给克隆对象,如下图所示: 在 Java 语言中要实现克隆则需要实现 Cloneable 接口,并重写 Object 类中的 clone() 方法,实现代码如下: 123456789101112131415161718192021222324252627282930313233343...

2021-04-10
1.3 里氏替换原则
1 里氏替换原则(Liskov Substitution Principle)为什么开放封闭原则(Open Closed Principle)是构建可维护性和可重用性代码的基础。它强调设计良好的代码可以不通过修改而扩展,新的功能通过添加新的代码来实现,而不需要更改已有的可工作的代码。抽象(Abstraction)和多态(Polymorphism)是实现这一原则的主要机制,而继承(Inheritance)则是实现抽象和多态的主要方法。 那么是什么设计规则在保证对继承的使用呢?优秀的继承层级设计都有哪些特征呢?是什么在诱使我们构建了不符合开放封闭原则的层级结构呢?这些就是本篇文章将要回答的问题。 是什么 里氏替换原则:所有引用基类的地方必须能透明地使用其子类的对象。使用基类对象指针或引用的函数必须能够在不了解衍生类的条件下使用衍生类的对象。 Functions that use pointers or references to base classes must be able to use objects of derived classes without knowing ...
2021-04-08
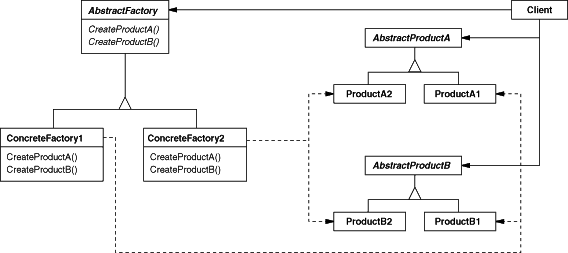
2.4 抽象工厂
抽象工厂abstract factory1 概念别名 Kit 意图提供一个创建一系列相关或相互依赖对象的接口,而无需指定它们具体的类。 结构抽象工厂模式创建的是对象家族,也就是很多对象而不是一个对象,并且这些对象是相关的,也就是说必须一起创建出来。而工厂方法模式只是用于创建一个对象,这和抽象工厂模式有很大不同。 抽象工厂模式用到了工厂方法模式来创建单一对象,AbstractFactory 中的 createProductA() 和 createProductB() 方法都是让子类来实现,这两个方法单独来看就是在创建一个对象,这符合工厂方法模式的定义。 至于创建对象的家族这一概念是在 Client 体现,Client 要通过 AbstractFactory 同时调用两个方法来创建出两个对象,在这里这两个对象就有很大的相关性,Client 需要同时创建出这两个对象。 从高层次来看,抽象工厂使用了组合,即 Cilent 组合了 AbstractFactory,而工厂方法模式使用了继承。 参与者AbstractFactory 声明一个创建抽象产品对象的操作接口。 Concrete...
2022-11-21
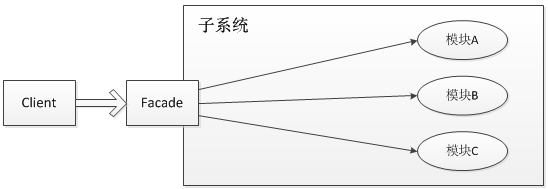
slf4j
原理说明slf4j是门面模式的典型应用,因此在讲slf4j前,我们先简单回顾一下门面模式, 门面模式,其核心为外部与一个子系统的通信必须通过一个统一的外观对象进行,使得子系统更易于使用。用一张图来表示门面模式的结构为: 门面模式的核心为Facade即门面对象,门面对象核心为几个点: 知道所有子角色的功能和责任 将客户端发来的请求委派到子系统中,没有实际业务逻辑 不参与子系统内业务逻辑的实现 解决这个问题的方式就是引入一个适配层,由适配层决定使用哪一种日志系统,而调用端只需要做的事情就是打印日志而不需要关心如何打印日志,slf4j或者commons-logging就是这种适配层,slf4j是本文研究的对象。 从上面的描述,我们必须清楚地知道一点:slf4j只是一个日志标准,并不是日志系统的具体实现。理解这句话非常重要,slf4j只做两件事情: 提供日志接口 提供获取具体日志对象的方法 slf4j的直接/间接实现有slf4j-simple、logback、slf4j-log4j12。slf4j-simple、logback都是slf4j的具体实现,log4j并不直...
2021-04-10
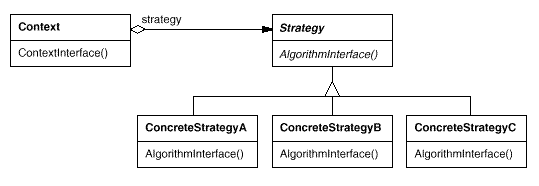
4.9 策略
策略 Strategy别名 Policy 意图定义一系列的算法,把它们一个个封装起来,并且使它们可以相互替换。使得算法可独立于使用它的客户而变化。 结构 参与者Strategy 定义所有支持的算法的公共接口。Context 使用这个接口来调用 ConcreteStrategy 定义的算法。 ConcreteStrategy 实现 Strategy 接口和具体算法。 Context 用一个 ConcreteStrategy 对象来配置。 维护一个对 Strategy 对象的引用。 可定义一个接口来让 Strategy 访问它的数据。 适用性在以下情况下可以使用 Strategy 模式: 许多相关的类仅仅是行为有异。Strategy 提供了一种用多个行为中的一个行为来配置一个类的方法。 需要使用一个算法的不同变体。 算法使用客户不应该知道的数据。 一个类定义了多种行为,并且这些行为在这个类的操作中以多个条件语句的形式出现。将相关条件分支移入它们各自的 Strategy 类中以代替。 缺点 客户必须了解不同的 Strategy。要选择合适的 Str...


