
demo_curvelinear_grid
演示Curvelinear网格
自定义网格和记号行。
此示例演示如何通过在网格上应用转换,使用GridHelperCurve线性来定义自定义网格和注释行。这可以用作第二个打印上的演示,用于在矩形框中创建极轴投影。

1 | import numpy as np |
下载这个示例
本博客所有文章除特别声明外,均采用 CC BY-NC-SA 4.0 许可协议。转载请注明来源 Estom的博客!
相关推荐

2021-12-24
rsync
rsync远程数据同步工具 补充说明rsync命令 是一个远程数据同步工具,可通过LAN/WAN快速同步多台主机间的文件。rsync使用所谓的“rsync算法”来使本地和远程两个主机之间的文件达到同步,这个算法只传送两个文件的不同部分,而不是每次都整份传送,因此速度相当快。 rsync是一个功能非常强大的工具,其命令也有很多功能特色选项,我们下面就对它的选项一一进行分析说明。 语法123456rsync [OPTION]... SRC DESTrsync [OPTION]... SRC [USER@]host:DESTrsync [OPTION]... [USER@]HOST:SRC DESTrsync [OPTION]... [USER@]HOST::SRC DESTrsync [OPTION]... SRC [USER@]HOST::DESTrsync [OPTION]... rsync://[USER@]HOST[:PORT]/SRC [DEST] 对应于以上六种命令格式,rsync有六种不同的工作模式: 拷贝本地文件。当SRC和DES路径信息都不包含有单个冒...
2021-03-20
23
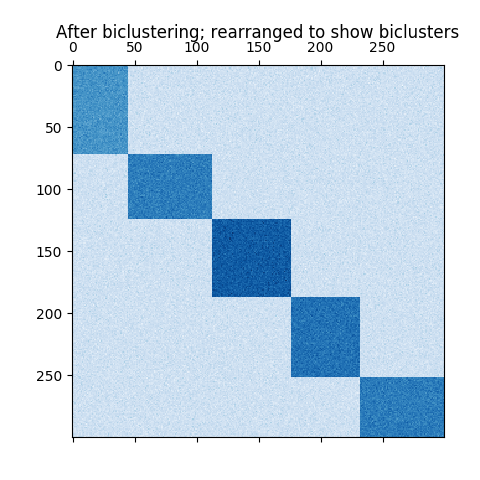
2.4. 双聚类校验者: @udy @barrycg翻译者: @程威 Biclustering(双向聚类) 的实现模块是 sklearn.cluster.bicluster。 双向聚类算法对数据矩阵的行列同时进行聚类。而这些行列的聚类称之为 双向簇(biclusters)。每一次聚类都会基于原始数据矩阵确定一个子矩阵, 并且这些子矩阵具有一些需要的属性。 例如, 给定一个矩阵 (10, 10) , 如果对其中三行二列进行双向聚类,就可以获得一个子矩阵 (3, 2)。 123456789>>> import numpy as np>>> data = np.arange(100).reshape(10, 10)>>> rows = np.array([0, 2, 3])[:, np.newaxis]>>> columns = np.array([1, 2])>>> data[rows, columns]array([[ 1, 2], [21, 22]...

2021-12-24
expr
expr一款表达式计算工具 补充说明expr命令 是一款表达式计算工具,使用它完成表达式的求值操作。 expr的常用运算符: 加法运算:+ 减法运算:- 乘法运算:\* 除法运算:/ 求摸(取余)运算:% 语法1expr(选项)(参数) 选项12--help:显示指令的帮助信息;--version:显示指令版本信息。 参数表达式:要求值的表达式。 实例12result=`expr 2 + 3`result=$(expr $no1 + 5)
2021-03-22
43 Pytorch分布式应用
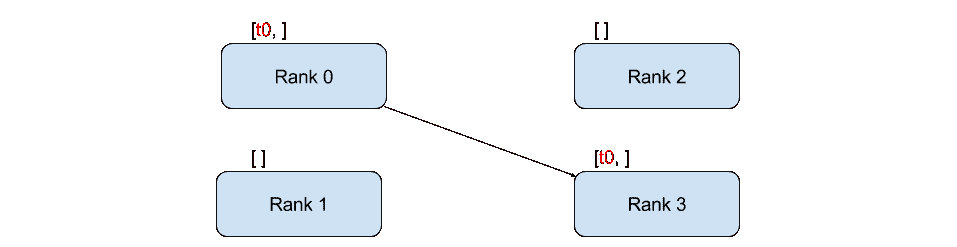
用 PyTorch 编写分布式应用 原文:https://pytorch.org/tutorials/intermediate/dist_tuto.html 作者:SébArnold 先决条件: PyTorch 分布式概述 在这个简短的教程中,我们将介绍 PyTorch 的分布式包。 我们将了解如何设置分布式设置,如何使用不同的交流策略以及如何查看包的一些内部内容。 设置PyTorch 中包含的分布式包(即torch.distributed)使研究人员和从业人员可以轻松地并行化他们在跨进程和机器集群的计算。 为此,它利用了传递消息的语义,从而允许每个进程将数据传递给任何其他进程。 与多处理包相反,进程可以使用不同的通信后端,而不仅限于在同一台计算机上执行。 为了开始,我们需要同时运行多个进程的能力。 如果您有权访问计算群集,则应咨询本地系统管理员或使用您喜欢的协调工具。 (例如 pdsh,clustershell 或其他)。出于本教程的目的,我们将使用以下模板使用一台计算机并分叉多个进程。 123456789101112131415161718192021222324252...
2022-11-27
01 Netty简介
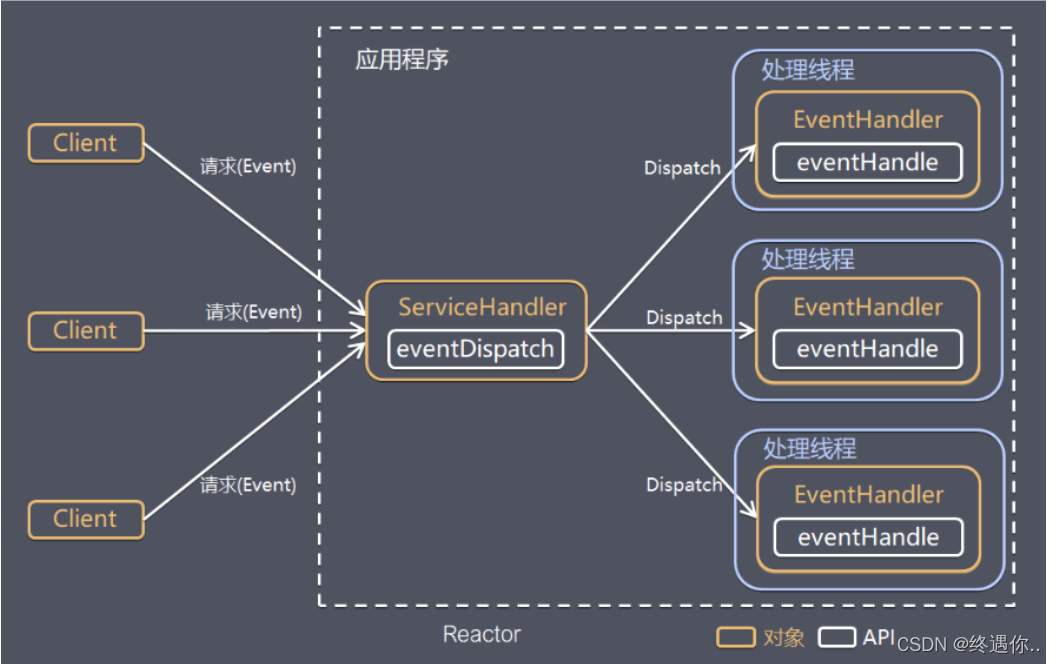
概述是什么Netty 是一个利用 Java 的高级网络的能力,隐藏其背后的复杂性而提供一个易于使用的 API 的客户端/服务器框架。 Netty和Tomcat最大的区别就在于通信协议,Tomcat是基于Http协议的Servlet容器,他的实质是一个基于http协议的web容器,但是Netty不一样,他能通过编程自定义各种协议,因为netty能够通过codec自己来编码/解码字节流,完成类似redis访问的功能,这就是netty和tomcat最大的不同。 对比Netty vs NIO,工作量大,bug 多 需要自己构建协议 解决 TCP 传输问题,如粘包、半包 epoll 空轮询导致 CPU 100% 对 API 进行增强,使之更易用,如 FastThreadLocal => ThreadLocal,ByteBuf => ByteBufferNetty更友好更强大:1、JDK中NIO的一些API功能薄弱且复杂,Netty隔离了JDK中NIO的实现变化及实现细节譬如:ByteBuffer -> ByteBuf主要负...
2020-10-11
15异常检测
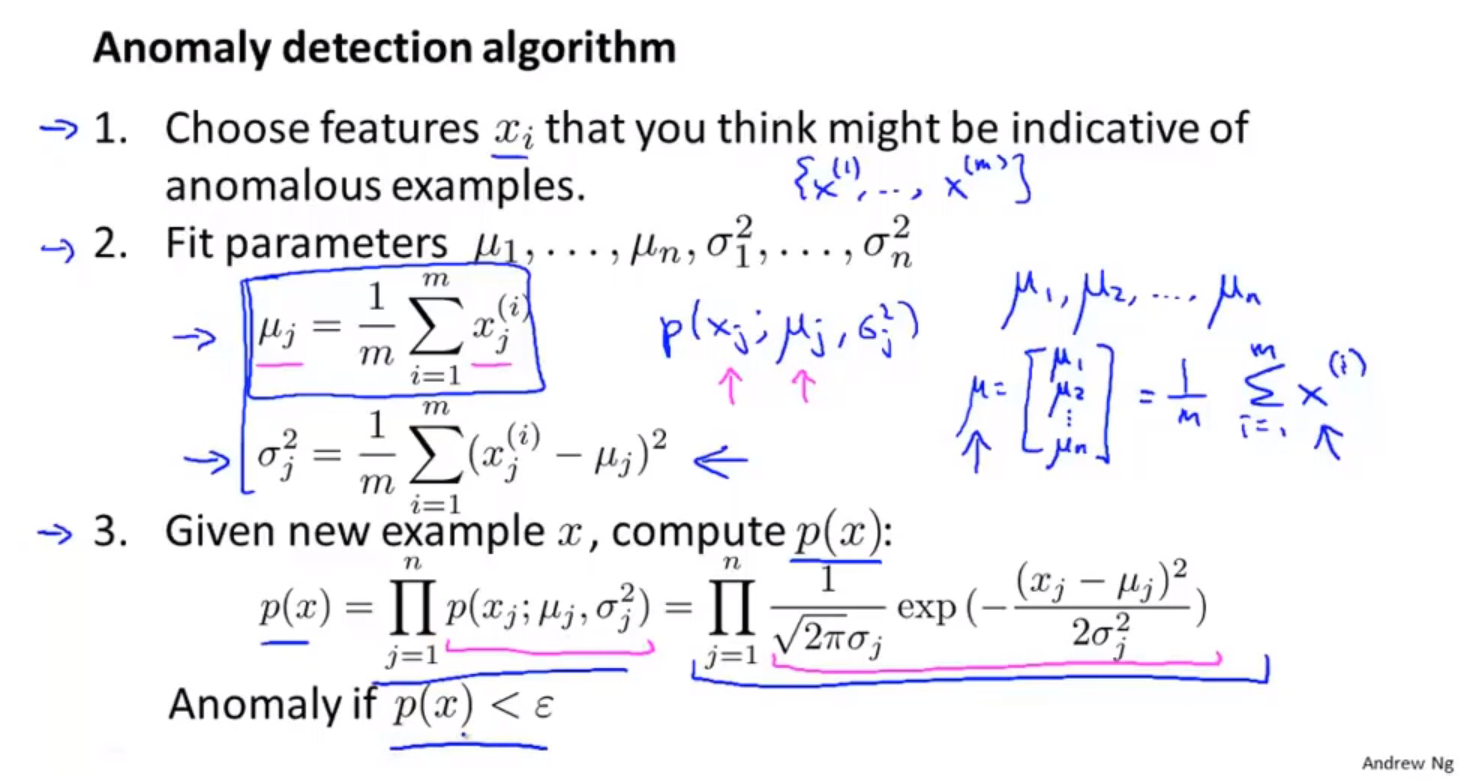
异常检测异常检测动机 定义一个描述事件的特征向量 当事件发生的特征向量偏离正常事件的特征向量时,被认为是异常事件。 飞机引擎的各个参数,判断飞机引擎是否正常。 优点类似有监督学习,但是只给出了单侧数据集的标签。 高斯分布-正态分布异常检测算法 首先使用极大似然法,假定样本的每一个参数符合正太分布,给出正太分布的模型。 然后将样本代入概率模型,计算每一个特征的分布概率,然后连乘。 设定以个边界值,当概率小于某个边界值的时候,表示样本数据不正常。 在这里假定样本的各个特征之间相互独立,连乘表示其联合概率密度。 并不是一种极其学习算法,而是一种简单的数据预处理算法,或者说统计学方法,通过统计学的计算,确定新给的样本是否存在问题,完成异常检测。 开发和评估异常检测系统在开发机器学习系统的过程中,关键是做选择,而不是实现机器学习系统。应该学会选择特征、选择训练算法、选择预处理、选择错误检测算法的方法,通过组合现有的方法,达到一个比较好的效果。 使用高斯分布进行异常检测的过程中,只考虑了单个特征变量的分布,而没有考虑各个特征变量之间可能存在的关系。 使用训练集,计算高维高...


