
demo_curvelinear_grid2
演示Curvelinear网格2
自定义网格和记号行。
此示例演示如何通过在网格上应用转换,使用GridHelperCurve线性来定义自定义网格和注释行。作为打印上的演示,轴上将显示5x5矩阵。

1 | import numpy as np |
下载这个示例
本博客所有文章除特别声明外,均采用 CC BY-NC-SA 4.0 许可协议。转载请注明来源 Estom的博客!
相关推荐

2021-12-24
df
df显示磁盘的相关信息 补充说明df命令 用于显示磁盘分区上的可使用的磁盘空间。默认显示单位为KB。可以利用该命令来获取硬盘被占用了多少空间,目前还剩下多少空间等信息。 语法1df(选项)(参数) 选项12345678910111213141516-a或--all:包含全部的文件系统;--block-size=<区块大小>:以指定的区块大小来显示区块数目;-h或--human-readable:以可读性较高的方式来显示信息;-H或--si:与-h参数相同,但在计算时是以1000 Bytes为换算单位而非1024 Bytes;-i或--inodes:显示inode的信息;-k或--kilobytes:指定区块大小为1024字节;-l或--local:仅显示本地端的文件系统;-m或--megabytes:指定区块大小为1048576字节;--no-sync:在取得磁盘使用信息前,不要执行sync指令,此为预设值;-P或--portability:使用POSIX的输出格式;--sync:在取得磁盘使用信息前,先执行sync指令;-t<文件系统类型>或--typ...

2019-11-14
ubuntu-gnome快捷键
1. 系统SUPER + 空格:切换输入法 SUPER + a:查找应用,a for application CTRL + q:退出当前应用,q for quit SUPER + F10:激活应用菜单 SUPER + F1:打开帮助 ALT + TAB:切换应用 ALT + 左方向键:切换到上一控制台 ALT + 右方向键:切换到下一控制台 2. 屏幕阅读器(Orca)ALT + SUPER + s:启用/关闭闭幕阅读器 ORCA + 空格: 显示首选项对话框(ORCA键是指Insert插入键或CAPS LOCK大小写转换键,取决于设置)ORCA + t: 读当前时间 ORCA + tt: 读当前日期 ORCA + s: 切换合成语音开关 ORCA + /: 朗读标题 ORCA + //: 朗读状态栏 ORCA + 分号: 朗读整个文件 ORCA + Q: 退出Orca 更多快捷键请参考Orca首选项的键绑定标签页 3. 浏览器(Firefox)启动Firefox的方法: SUPER + a,然后按firefox,回车。这个是在Dash面板...

2021-04-10
1.5 接口隔离原则
1 接口隔离原则概念 接口隔离原则:客户端不应该依赖那些它不需要的接口。 当一个接口太大时,应该将它根据需要分割成多个更细小的接口,每个接口仅承担一个相对独立的角色或功能,使用该接口的客户端仅需知道与之相关的方法即可。 但是,接口不能过小,否则系统中接口太多,不利于维护。一般而言,在接口中仅包含为某一类用户定制的方法即可。

2021-12-24
named-checkzone
named-checkzone使用named-checkzone命令可以进行区域文件有效性检查和转换,必须指定区域名称和区域文件名称 补充说明named-checkzone命令 可以进行区域文件有效性检查和转换,必须指定区域名称和区域文件名称。 语法1named-checkzone [选项] [区域名] [区域文件名] 选项123-q 安静模式-d 启用调试-c <类别> 指定区域的类别。如果没指定就使用IN 例子对区域文件/var/named/192.168.0.rev进行有效性检查和转换。 123[root@localhost ~]# named-checkzone 0.168.192.in-addr.arpa /var/named/192.168.0.revzone0.168.192.in-addr.arpa/IN: loaded serial 1268360612OK 对区域文件/var/named/sh.com.hosts进行有效性检查和转换。 1234[root@localhost ~]# ...

2020-09-26
trigradient_demo
Trigradient 演示使用 matplotlib.tri.CubicTriInterpolator 演示梯度计算。 1234567891011121314151617181920212223242526272829303132333435363738394041424344454647484950515253545556575859606162636465666768697071727374757677787980from matplotlib.tri import ( Triangulation, UniformTriRefiner, CubicTriInterpolator)import matplotlib.pyplot as pltimport matplotlib.cm as cmimport numpy as np#-----------------------------------------------------------------------------# Electrical potential of a dipole#----------...
2023-08-16
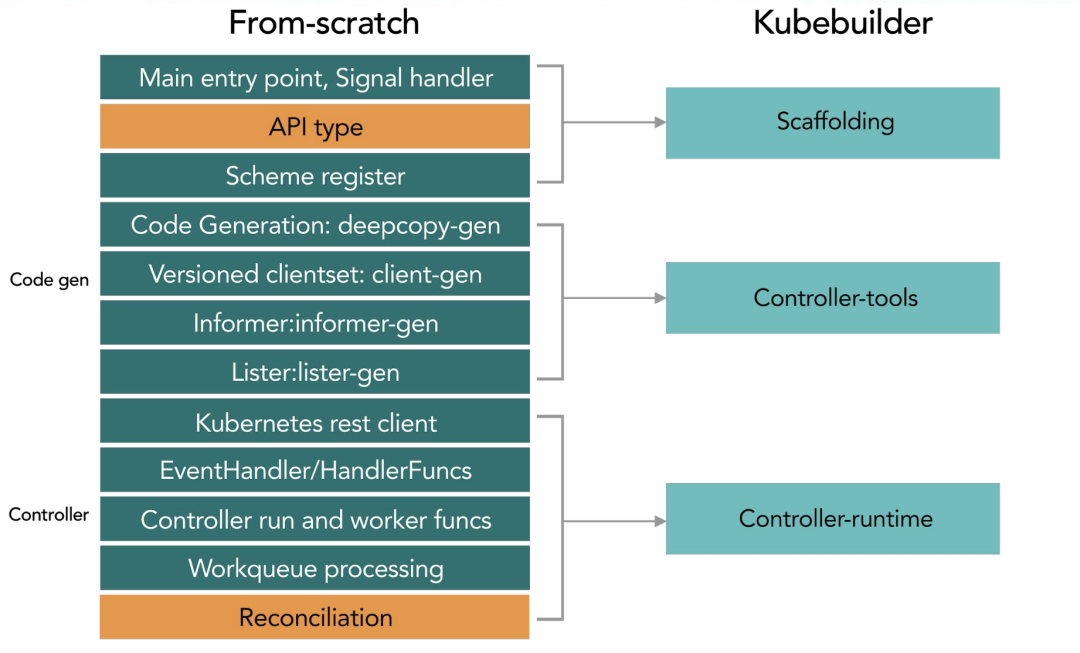
03 Kubebuilder
1 概述构建阶段 工作流程 2 使用流程安装kubebuilder12brew install kubebuilderkubebuilder version 创建工程 初始化一个项目目录 123mkdir -p $GOPATH/src/ykl.com/customer-controller/go mod init contollers.happyhacker.io 定义crd所属的domain,生成一个工程.定义 crd 所属的 domain,这个指令会帮助你生成一个工程。 1kubebuilder init --domain estom.com --license apache2 --owner "Estom" 创建后的目录结构如下: cmd目录下是启动脚本,编译后会在bin目录下生成manage可执行文件 config目录下是基础工程配置。 1234567891011121314151617181920212223242526272829303132.├── Dockerfile├── Makefile├── PROJECT├── READ...


