
coords_demo
Coords 演示
如何通过连接到移动和单击事件来与绘图画布交互的示例

1 | import sys |
下载这个示例
本博客所有文章除特别声明外,均采用 CC BY-NC-SA 4.0 许可协议。转载请注明来源 Estom的博客!
相关推荐
2022-04-18
web-sockets
什么是 Web SocketsWeb Sockets 技术使得浏览器直接与服务器端的程序通过 socket 可以实时的推送或者获取信息的通讯方式成为可能。 在 HTML5 之前实现浏览器与服务器端实时通信的技术如下: 轮询:原理简单易懂,就是客户端通过一定的时间间隔以频繁请求的方式向服务器发送请求,来保持客户端和服务器端的数据同步。 Flash:Flash 通过自己的 Socket 实现完成数据交换,再利用 Flash 暴露出相应的接口为 JavaScript 调用,从而达到实时传输目的。 Web Sockets 的优势与劣势Web Sockets 的优势 Web Sockets 提供强大的、双向、低延迟和易于处理的错误。 它没有很多连接,比如:Comet 长轮询。 Web Sockets 的劣势 Web Sockets 是 HTML5 的新规范,并不是所有浏览器都支持。 无请求作用域。由于 Web Sockets 是一个 TCP 套接字,而不是一个 HTTP 请求,因此无法轻松使用请求作用域服务。 Web Sockets 的实现原理下图展示了如何使用 WebSocket...

2020-09-26
keypress_demo
按键演示显示如何连接到按键事件 12345678910111213141516171819202122232425import sysimport numpy as npimport matplotlib.pyplot as pltdef press(event): print('press', event.key) sys.stdout.flush() if event.key == 'x': visible = xl.get_visible() xl.set_visible(not visible) fig.canvas.draw()# Fixing random state for reproducibilitynp.random.seed(19680801)fig, ax = plt.subplots()fig.canvas.mpl_connect('key_press_event', press)ax.plot(np.random.rand(12),...

2020-09-26
close_event
关闭事件显示图形关闭时发生的连接事件的示例。 1234567891011import matplotlib.pyplot as pltdef handle_close(evt): print('Closed Figure!')fig = plt.figure()fig.canvas.mpl_connect('close_event', handle_close)plt.text(0.35, 0.5, 'Close Me!', dict(size=30))plt.show() 下载这个示例 下载python源码: close_event.py 下载Jupyter notebook: close_event.ipynb
2022-11-27
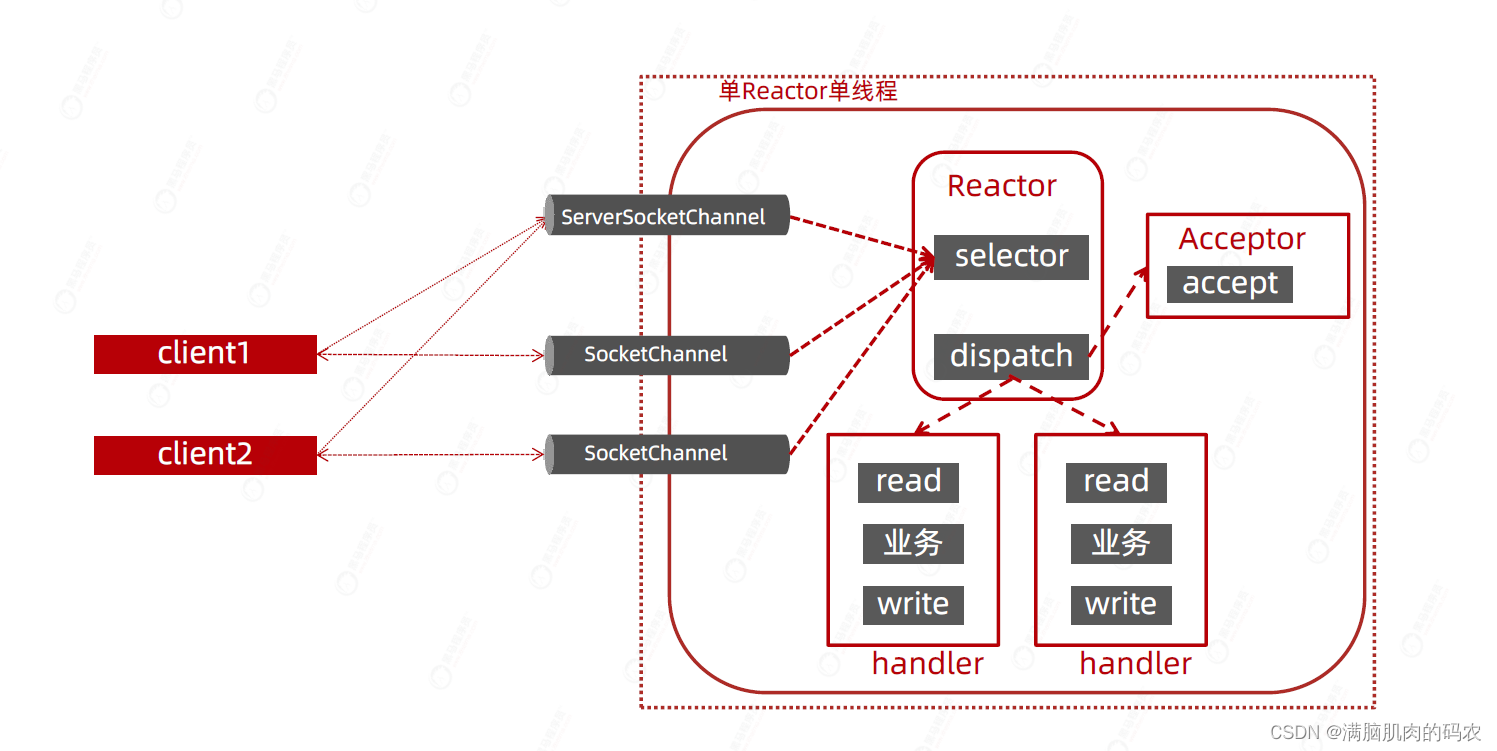
04 Reactor与Netty
Reactor与NettyReactor概念Reactor模型中定义了三种角色: Reactor:负责监听和分配事件,将I/O事件分派给对应的Handler。新的时间包含连接建立就绪、读就绪、写就绪等。 Acceptor:处理客户端新连接,并分派请求到处理器链中。 Handler:将自身与事件绑定,执行费阻塞读/写人物,完成channel的读入,完成处理业务逻辑后,负责将结果写出channel。 单Reactor - 单线程模型NIO下Reactor单线程,所有的接受连接,处理数据的相关操作都在一个线程中完成,性能上有瓶颈。 单Reactor - 多线程模型把比较消耗时的数据的编解码运算操作放入线程池中执行,虽然提升了性能但是还不是最好的方式。 主从Reactor - 多线程主从多线程,对于服务器来说,接收客户端的连接是比较重要的,因此将这部分操作单独用线程去操作。 这种模式的基本工作流程为: Reactor主线程MainReactor对象通过select监听客户端连接事件,收到事件后,通过Acceptor处理客户端连接事件。 当Acceptor处...

2020-09-26
zoom_window
缩放窗口此示例显示如何将一个窗口(例如鼠标按键)中的事件连接到另一个体形窗口。 如果单击第一个窗口中的某个点,将调整第二个窗口的z和y限制,以便第二个窗口中缩放的中心将是所单击点的x,y坐标。 请注意,散点图中圆的直径以点**2定义,因此它们的大小与缩放无关。 123456789101112131415161718192021222324252627import matplotlib.pyplot as pltimport numpy as npfigsrc, axsrc = plt.subplots()figzoom, axzoom = plt.subplots()axsrc.set(xlim=(0, 1), ylim=(0, 1), autoscale_on=False, title='Click to zoom')axzoom.set(xlim=(0.45, 0.55), ylim=(0.4, 0.6), autoscale_on=False, title='Zoom window')x, y,...

2021-12-24
netstat
netstat查看Linux中网络系统状态信息 补充说明netstat命令 用来打印Linux中网络系统的状态信息,可让你得知整个Linux系统的网络情况。 语法1netstat(选项) 选项123456789101112131415161718192021222324-a或--all:显示所有连线中的Socket;-A<网络类型>或--<网络类型>:列出该网络类型连线中的相关地址;-c或--continuous:持续列出网络状态;-C或--cache:显示路由器配置的快取信息;-e或--extend:显示网络其他相关信息;-F或--fib:显示FIB;-g或--groups:显示多重广播功能群组组员名单;-h或--help:在线帮助;-i或--interfaces:显示网络界面信息表单;-l或--listening:显示监控中的服务器的Socket;-M或--masquerade:显示伪装的网络连线;-n或--numeric:直接使用ip地址,而不通过域名服务器;-N或--netlink或--symbolic:显示网络硬件外围设备的符号连接名称;-o或...


