
pick_event_demo2
选择事件演示2
计算100个数据集的平均值和标准差(stddev),并绘制平均值vs stddev。单击其中一个mu,sigma点时,绘制生成均值和stddev的数据集中的原始数据。

1 | import numpy as np |
下载这个示例
本博客所有文章除特别声明外,均采用 CC BY-NC-SA 4.0 许可协议。转载请注明来源 Estom的博客!
相关推荐
2020-09-10
6events模块
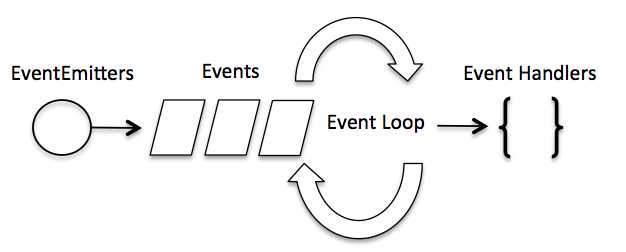
事件循环1 模块说明过程 Node.js 是单进程单线程应用程序 Node.js 几乎每一个 API 都是支持回调函数的。 Node.js 基本上所有的事件机制都是用设计模式中观察者模式实现。 Node.js 单线程类似进入一个while(true)的事件循环,直到没有事件观察者退出,每个异步事件都生成一个事件观察者,如果有事件发生就调用该回调函数. 示例 Node.js 使用事件驱动模型,当web server接收到请求,就把它关闭然后进行处理,然后去服务下一个web请求。当这个请求完成,它被放回处理队列,当到达队列开头,这个结果被返回给用户。 非阻塞式IO,事件驱动IO 事件相当于一个主题(Subject),而所有注册到这个事件上的处理函数相当于观察者(Observer)。 2 模块应用示例12345678910111213141516171819202122232425// 引入 events 模块var events = require('events');// 创建 eventEmitter 对象var eventEmitter = new e...

2020-09-26
close_event
关闭事件显示图形关闭时发生的连接事件的示例。 1234567891011import matplotlib.pyplot as pltdef handle_close(evt): print('Closed Figure!')fig = plt.figure()fig.canvas.mpl_connect('close_event', handle_close)plt.text(0.35, 0.5, 'Close Me!', dict(size=30))plt.show() 下载这个示例 下载python源码: close_event.py 下载Jupyter notebook: close_event.ipynb

2020-09-26
trifinder_event_demo
Trifinder 事件演示显示使用TriFinder对象的示例。当鼠标在三角测量上移动时,光标下方的三角形将突出显示,三角形的索引将显示在图表标题中。 12345678910111213141516171819202122232425262728293031323334353637383940414243444546474849505152import matplotlib.pyplot as pltfrom matplotlib.tri import Triangulationfrom matplotlib.patches import Polygonimport numpy as npdef update_polygon(tri): if tri == -1: points = [0, 0, 0] else: points = triang.triangles[tri] xs = triang.x[points] ys = triang.y[points] polygon.set_xy(np.column_stac...

2020-09-26
pick_event_demo
选择事件演示您可以通过设置艺术家的“选择器”属性来启用拾取(例如,matplotlib Line2D,Text,Patch,Polygon,AxesImage等…) 选择器属性有多种含义 None - 此艺术家对象的选择功能已停用(默认) boolean - 如果为True,则启用拾取,如果鼠标事件在艺术家上方,艺术家将触发拾取事件 float - 如果选择器是一个数字,则它被解释为以点为单位的epsilon容差,如果事件的数据在鼠标事件的epsilon内,则艺术家将触发事件。 对于某些艺术家(如线条和补丁集合),艺术家可能会为生成的挑选事件提供其他数据,例如,挑选事件的epsilon中的数据索引 function - 如果选择器是可调用的,则它是用户提供的函数,用于确定艺术家是否被鼠标事件命中。 hit, props = picker(artist, mouseevent) 确定命中测试。 如果鼠标事件在艺术家上方,则返回hit = True,props是要添加到PickEvent属性的属性字典 通过设置“选取器”属性启用艺术家进行拾取后...
2022-11-27
04 Reactor与Netty
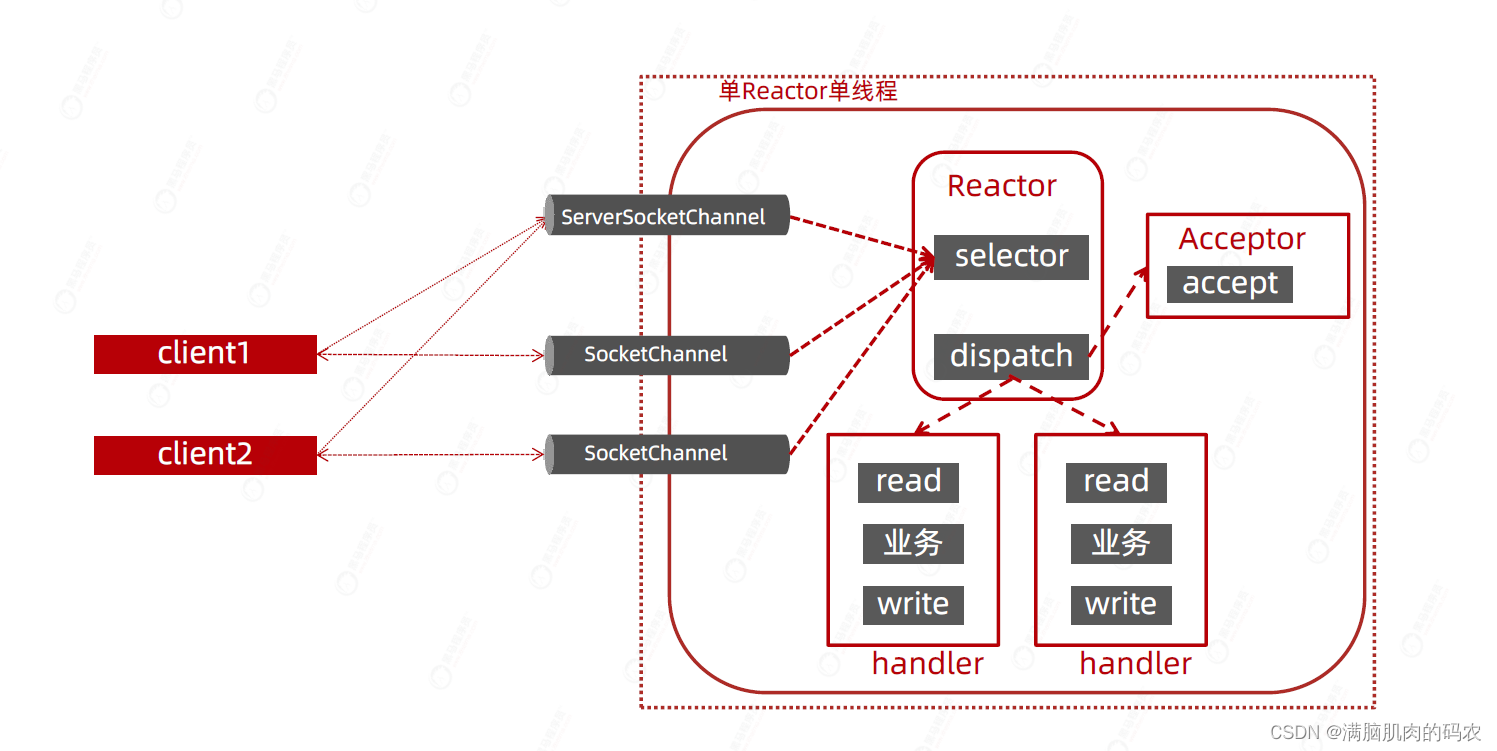
Reactor与NettyReactor概念Reactor模型中定义了三种角色: Reactor:负责监听和分配事件,将I/O事件分派给对应的Handler。新的时间包含连接建立就绪、读就绪、写就绪等。 Acceptor:处理客户端新连接,并分派请求到处理器链中。 Handler:将自身与事件绑定,执行费阻塞读/写人物,完成channel的读入,完成处理业务逻辑后,负责将结果写出channel。 单Reactor - 单线程模型NIO下Reactor单线程,所有的接受连接,处理数据的相关操作都在一个线程中完成,性能上有瓶颈。 单Reactor - 多线程模型把比较消耗时的数据的编解码运算操作放入线程池中执行,虽然提升了性能但是还不是最好的方式。 主从Reactor - 多线程主从多线程,对于服务器来说,接收客户端的连接是比较重要的,因此将这部分操作单独用线程去操作。 这种模式的基本工作流程为: Reactor主线程MainReactor对象通过select监听客户端连接事件,收到事件后,通过Acceptor处理客户端连接事件。 当Acceptor处...

2020-09-26
eventplot_demo
绘制plot事件图的示例一个事件图,显示具有各种线属性的事件序列。该图以水平和垂直方向显示。 ; 1234567891011121314151617181920212223242526272829303132333435363738394041424344454647484950515253545556import matplotlib.pyplot as pltimport numpy as npimport matplotlibmatplotlib.rcParams['font.size'] = 8.0# Fixing random state for reproducibilitynp.random.seed(19680801)# create random datadata1 = np.random.random([6, 50])# set different colors for each set of positionscolors1 = np.array([[1, 0, 0], [0, 1, 0], ...


