
resample
重采样数据
下采样会降低信号的采样率或采样大小。在本教程中,当通过拖动和缩放调整打印时,将对信号进行缩减采样。

1 | import numpy as np |
下载这个示例
本博客所有文章除特别声明外,均采用 CC BY-NC-SA 4.0 许可协议。转载请注明来源 Estom的博客!
相关推荐

2021-03-09
12 transient关键字
序列化对序列化的理解 JAVA序列化是指把JAVA对象转换为字节序列的过程。JAVA反序列化是吧字节恢复为JAVA对象。 应用:当两个进程进行远程通信时,可以相互发送各种类型的数据。包括文本、图片、音频、视频,这些数据都是以二进制序列的形式在网络上传送。 两个JAVA进程通信的时候,也可以传送对象,将JAVA序列化为字节序列,装载为字节流,然后进行传送。.接收端将字节流反序列化为JAVA对象。 作用:实现了数据的持久化,通过序列化,能够将数据永久的保存到硬盘上。利用序列化可以实现数据流的输入输出和远程通信。 实现方法: java.io.ObjectOuptutStream:对象输出流writeObject() java.io.ObjectInputStream:对象输入流readObject() 对象能被序列化的要求 implement了Serializable接口,通过默认的方法进行序列化 implement了Serializable接口,并且实现了相应的方法,然后通过自己的方式进行序列化和反序列化 序列化的步骤: 步骤一:创建一个对象输出流,它可以包装一个其它类型的目标输出流...
2021-03-09
网络层学习之二(IPv4及IPv6地址及相关协议)
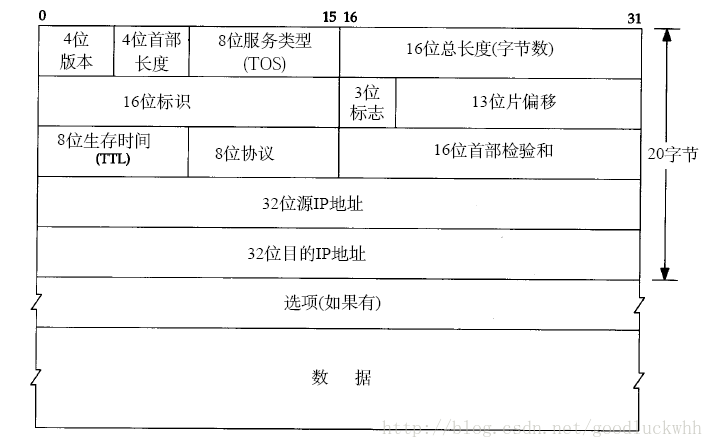
IP(internetprotocol)协议是TCP/IP协议族的核心协议,是因特网的网络层。当前的版本号是4,也称为IPv4,下一代IP协议的版本号为6即IPv6。正如描述的网络层功能一样,IP层为因特网提供了选路和转发的功能。接入因特网的主机之间可以通过IP层而互相通信,在IP层,IP地址用于标识接入网络的接口,进而标识一台主机。当信息在TCP/IP协议栈中传递时,每层都会添加其自己的控制信息,即协议头,IP地址被添加在IP头中。IP头提供了IP协议以及数据报的信息。 一、IPv4数据报格式 当接入网络的两台设备通过IP层互相通讯时,交互的信息会被封装成网络层分组,网络层分组又被称为数据报。IPv4的数据报格式如下: 其各个字段的含义如下: 版本号:协议版本号,IPv4为4,IPv6则为6(当然IPv6的头部不完全是这样,但是4个比特含义一致) 首部长度:首部长度指的是首部占32bit字的数目,包括任何选项。因此IPv4首部最长为60个字节 服务类型:服务类型(TOS)字段包括一个3 bit的优先权子字段(现在已被忽略),4bit的TOS子字段和1...

2021-12-24
hostname
hostname显示和设置系统的主机名 补充说明hostname命令用于显示和设置系统的主机名称。 环境变量 HOSTNAME 也保存了当前的主机名。 在使用 hostname 命令设置主机名后,系统并不会永久保存新的主机名,重启之后还是原来的主机名。如果需要永久修改主机名,需要修改 /etc/hosts 和 /etc/sysconfig/network 的相关内容并进行重启;也可以使用 hostnamectl 命令进行永久修改。 语法12345678910hostname [-b] {hostname|-F file} 设置主机名称(或从文件获取)hostname [-a|-A|-d|-f|-i|-I|-s|-y] 显示格式化的名称hostname 显示主机名称{yp,nis,}domainname {nisdomain|-F file} 设置 NIS 主机名称(或从文件获取){yp,nis,&#...

2021-12-29
3.2 伏特加
伏特加1 基本介绍生命之水 伏特加酒(vodka、Водка),俄罗斯的传统酒精饮料。伏特加酒以谷物或马铃薯为原料,经过蒸馏制成高达95度的酒精,再用蒸馏水淡化至40度到60度,并经过活性炭过滤,使酒质更加晶莹澄澈,无色且清淡爽口,使人感到不甜、不苦、不涩,只有烈焰般的刺激,形成伏特加酒独具一格的特色。伏特加酒在各种调制鸡尾酒的基酒之中,是一种最具有灵活性、适应性和变通性的酒。 2 制造原料虽然现在大部分伏特加都是采用谷物(特别是大麦、小麦和黑麦)酿造而成,但是实际上,伏特加在酿造原料上并没有任何特殊的要求,所有能够进行发酵的原料都可以用来酿造伏特加,当然包括葡萄和马铃薯。 伏特加的传统酿造法是首先以马铃薯或玉米、大麦、黑麦为原料,用精馏法蒸馏出酒度高达96%的酒精液,再使酒精液流经盛有大量木炭的容器,以吸附酒液中的杂质(每10升蒸馏液用1.5千克木炭连续过滤不得少于8小时,40小时后至少要换掉10%的木炭),最后用蒸馏水稀释至酒度40-50%,除去酒精中所含毒素和其它异物的一种纯净的高酒精浓度的饮料。 伏特加酒不用陈酿即可出售、饮用,也有少量的如香型伏特加在稀释后还要经串香程序...

2021-12-24
find
find在指定目录下查找文件 补充说明find命令 用来在指定目录下查找文件。任何位于参数之前的字符串都将被视为欲查找的目录名。如果使用该命令时,不设置任何参数,则find命令将在当前目录下查找子目录与文件。并且将查找到的子目录和文件全部进行显示。 语法1find(选项)(参数) 选项内容 名称 -name 类型 -type f/d 时间 -mmin/mtime +- 空间 -size 权限 -perm 用户 -user/group 选项12345678910111213141516171819202122232425262728293031323334353637383940414243444546474849505152535455565758596061626364656667686970717273747576777879名称-name<范本样式>:指定字符串作为寻找文件或目录的范本样式;-regex<范本样式>:指定字符串作为寻找文件或目录的范本样式;类型-type<文件类型>:只寻找符合指定的文件类...
2021-03-09
Django——关于URL分组匹配问题
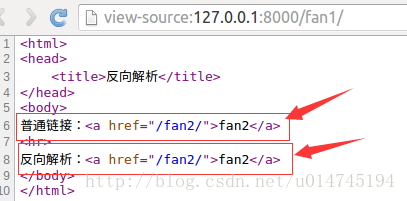
**基本原则说明:** - Django会一次匹配列表中的每个URL模式,在遇到第一个请求的URL相匹配的模式时停下来 - 分组传参包括以下内容: - 一个HttpRequest实例。 - 如果正则表达式是无名组,那么正则表达式所匹配的内容将作为位置参数提供给视图。 - 如果正则表达式是命名组,那么正则表达式所匹配的内容将作为关键参数提供给视图。 - 对于GET、POST请求本身的参数不进行匹配。作为扩展参数kwargs提供给视图。 - 如果请求的URL没有匹配到任何一个正则表达式,或者匹配过程中抛出异常,会进行相应的错误处理。 分组参数 关键参数 **匹配分组算法说明:** \> 分组对应参数,是如何传递参数的过程;匹配分组算法,是如何匹配字符串的过程。 - 如果有命名参数,则使用命名参数,忽略非命名参数。 - 否则,将以位置参数传递所有的非命名参数。 - 所有的匹配结果都是字符串 能够通过url函数额外传递多个参数。 终于他妈的明白这种关键参数和位置参数的意思了: 关键...


