
trifinder_event_demo
Trifinder 事件演示
显示使用TriFinder对象的示例。当鼠标在三角测量上移动时,光标下方的三角形将突出显示,三角形的索引将显示在图表标题中。

1 | import matplotlib.pyplot as plt |
下载这个示例
本博客所有文章除特别声明外,均采用 CC BY-NC-SA 4.0 许可协议。转载请注明来源 Estom的博客!
相关推荐

2022-04-18
drag-and-drop
允许用户在一个元素上点击并按住鼠标按钮,拖动它到别的位置,然后松开鼠标按钮将元素放到那儿。 在拖动操作过程中,被拖动元素会以半透明形式展现,并跟随鼠标指针移动。放置元素的位置可能会在不同的应用内。 源元素事件所谓源元素就是被拖动的元素。 事件名称 作用 触发次数 dragstart事件 开始拖动源元素时被触发 只被触发一次 drag事件 拖动的过程中,实时被触发 被触发多次 dragend事件 结束拖动源元素时被触发 只被触发一次 123456789101112131415161718192021<div id="d1"> <img id="img" src="/note_image/HTML/html5/Penguins.jpg" width="256"></div><script> // 获取HTML页面中的源元素<img> var img = document.getElementById("img&q...

2021-03-09
11 UML笔记之活动图
UML活动图 概念 活动图是另一个种动态视图,描述动作和动作导致对象状态改变的结果,而不用考虑引发状态改变的事件。描述了系统从一种活动转换到另一种活动的过程。 活动图的作用: 用来描述系统或者某个业务的处理流程,业务相关的工作流描述、用例的事件流描述、程序的算法描述。描述业务或软件系统的活动轨迹。说明了了一系列活动控制流。 活动图的图组成元素: 1、起点 【作用】描述活动图的开始状态 【表示方式】黑的实心圆 2、终止点 【作用】描述活动图的终止状态 【表示方式】实心圆的空心圆 3、活动 【作用】可以是手动也可以自动的执行任务。构成业务和处理的一个单位,用圆角长方形表示。 【表示方式】圆角矩形 4、状态 【作用】活动的所处状态 【表示方式】椭圆矩形 5、转换,控制流 【作用】描述一个活动转向另一个活动 【表示方式】带箭头的实线段,指向转向的活动 6. 判决节点和监护条件 【作用】一个输入转换,多个输出转换,每个输出转换上都有一个监护条件,用来表示满足条件时才进行转换。 【表示方式】菱形表示 7. 分叉和汇合(fork并发节点和join并发节点) 8. ...
2021-03-09
12 UML笔记之状态图
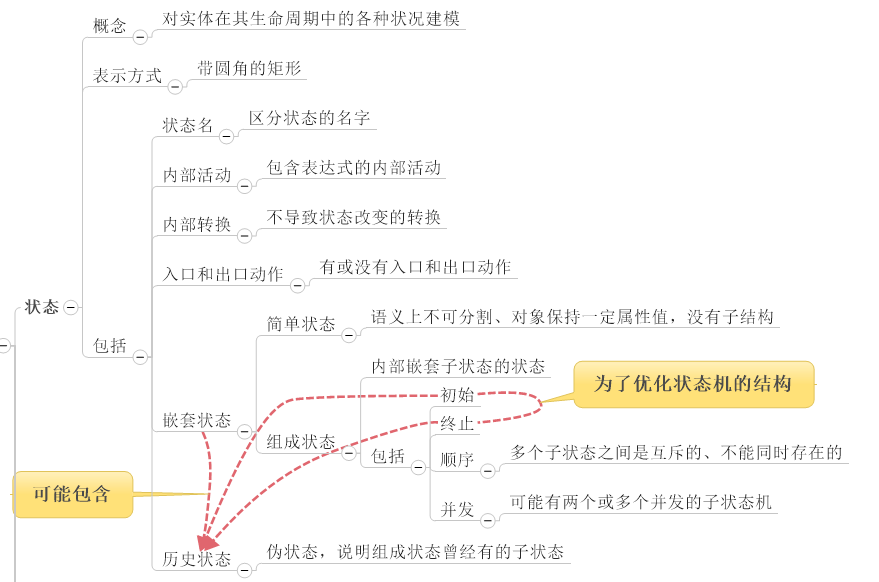
UML状态图 定义 对象在生命周期内、在外部时间的作用下,对象从一中状态迁移到另一种状态构成的完整系列图,就是一个状态机。 记录下给定时刻状态的机器,根据不同的输入对每个给定的变化而改变其状态或引发一个动作。 在UML中,状态机由对象的各个状态和连接这些状态的转换组成,是展示状态与状态转换的图。 状态图本质上就是一个状态机或是状态机的特殊情况。由表示状态的节点和表示状态之间转换的带箭头的直线组成。 状态机图的作用: 状态机图用来描述一个对象从生成到消失整个生命周期内所经历的状态变化。。状态机图用来反映型对象的行为建模(时间响应) 表示一个对象对于来自外部的事件如何做出反应的情况。 当生命周期内有复杂状态变化的对象,或者需要把握其状态迁移变化的对象才需要画状态机图。 包括状态序列、引发事件、一系列响应动作 状态机的组成元素: 状态(初始状态结束状态一般状态)、转移、事件、动作。 认识状态的概念和分类: 状态图示例 状态图的表示 状态的表示方法: 初始状态:对象的起始状态 终止状态:对象最后的状态。 中间状态:使用对象的属性来描述对象...

2022-04-18
web-storage
在开发 Web 应用时,开发人员有时需要在本地存储数据。当前浏览器支持 cookie 存储,但其大小有 4KB 的限制。 HTML5 中新引入了 Web Storage 机制,通过使用键值对在客户端保存数据,并且提供了更大容量的存储空间。 HTML5 中的 Web 存储对象有两种类型: sessionStorage 对象负责存储一个会话的数据。如果用户关闭了页面或浏览器,则会销毁数据。 localStorage 对象负责存储没有到期的数据。当 Web 页面或浏览器关闭时,仍会保持数据的存储,当然这还取决于为此用户的浏览器设置的存储量。 这两种存储对象具有相同的方法和属性。 **值得注意的是:**Web 存储并不比 cookies 安全。所以不要在客户端存储敏感信息,比如密码或信用卡信息。 官方规范资料地址:https://html.spec.whatwg.org/multipage/webstorage.html sessionStorge浏览器支持性检查1234567//sessionStorage if(window.sessionStorage){ ...
2020-09-10
6events模块
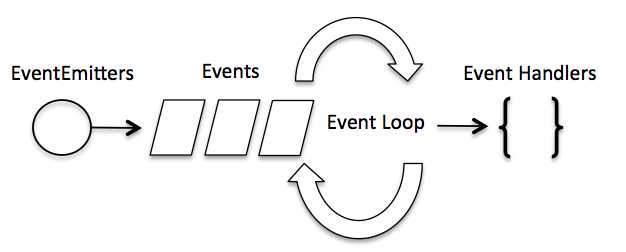
事件循环1 模块说明过程 Node.js 是单进程单线程应用程序 Node.js 几乎每一个 API 都是支持回调函数的。 Node.js 基本上所有的事件机制都是用设计模式中观察者模式实现。 Node.js 单线程类似进入一个while(true)的事件循环,直到没有事件观察者退出,每个异步事件都生成一个事件观察者,如果有事件发生就调用该回调函数. 示例 Node.js 使用事件驱动模型,当web server接收到请求,就把它关闭然后进行处理,然后去服务下一个web请求。当这个请求完成,它被放回处理队列,当到达队列开头,这个结果被返回给用户。 非阻塞式IO,事件驱动IO 事件相当于一个主题(Subject),而所有注册到这个事件上的处理函数相当于观察者(Observer)。 2 模块应用示例12345678910111213141516171819202122232425// 引入 events 模块var events = require('events');// 创建 eventEmitter 对象var eventEmitter = new e...

2020-09-26
pick_event_demo
选择事件演示您可以通过设置艺术家的“选择器”属性来启用拾取(例如,matplotlib Line2D,Text,Patch,Polygon,AxesImage等…) 选择器属性有多种含义 None - 此艺术家对象的选择功能已停用(默认) boolean - 如果为True,则启用拾取,如果鼠标事件在艺术家上方,艺术家将触发拾取事件 float - 如果选择器是一个数字,则它被解释为以点为单位的epsilon容差,如果事件的数据在鼠标事件的epsilon内,则艺术家将触发事件。 对于某些艺术家(如线条和补丁集合),艺术家可能会为生成的挑选事件提供其他数据,例如,挑选事件的epsilon中的数据索引 function - 如果选择器是可调用的,则它是用户提供的函数,用于确定艺术家是否被鼠标事件命中。 hit, props = picker(artist, mouseevent) 确定命中测试。 如果鼠标事件在艺术家上方,则返回hit = True,props是要添加到PickEvent属性的属性字典 通过设置“选取器”属性启用艺术家进行拾取后...


