
affine_image
图像的仿射变换
将仿射变换(Affine2D)预先添加到图像的数据变换允许操纵图像的形状和方向。这是变换链的概念的一个例子。
对于支持具有可选仿射变换的draw_image的后端(例如,agg,ps后端),输出的图像应该使其边界与虚线黄色矩形匹配。
1 | import numpy as np |

参考
此示例中显示了以下函数,方法和类的使用:
1 | import matplotlib |
下载这个示例
本博客所有文章除特别声明外,均采用 CC BY-NC-SA 4.0 许可协议。转载请注明来源 Estom的博客!
相关推荐

2021-12-24
mtools
mtools显示mtools支持的指令 补充说明mtools命令 显示mtools支持的指令,mtools为MS-DOS文件系统的工具程序,可模拟许多MS-DOS的指令。这些指令都是mtools的符号连接,因此会有一些共同的特性。 语法1mtools(选项) 选项12345678910-a:长文件名重复时自动更改目标文件的长文件名;-A:短文件名重复但长文件名不同时自动更改目标文件的短文件名;-o:长文件名重复时,将目标文件覆盖现有的文件;-O:短文件名重复但长文件名不同时,将目标文件覆盖现有的文件;-r:长文件名重复时,要求用户更改目标文件的长文件名;-R:短文件名重复但长文件名不同时,要求用户更改目标文件的短文件名;-s:长文件名重复时,则不处理该目标文件;-S:短文件名重复但长文件名不同时,则不处理该目标文件;-v:执行时显示详细的说明;-V:显示版本信息。 实例使用mtools命令显示其支持的所有的指令,输入如下命令: 123456[root@localhost ~]# mtools #显示所有支持的指令名称Supported commands:mattrib...

2021-12-24
ed
ed单行纯文本编辑器 补充说明ed命令 是单行纯文本编辑器,它有命令模式(command mode)和输入模式(input mode)两种工作模式。ed命令支持多个内置命令,常见内置命令如下: 语法1ed(选项)(参数) 选项1234567A # 切换到输入模式,在文件的最后一行之后输入新的内容;C # 切换到输入模式,用输入的内容替换掉最后一行的内容;i # 切换到输入模式,在当前行之前加入一个新的空行来输入内容;d # 用于删除最后一行文本内容;n # 用于显示最后一行的行号和内容;w # <文件名>:一给定的文件名保存当前正在编辑的文件;q # 退出ed编辑器。 12345-G或——traditional:提供兼容的功能;-p<字符串>:指定ed在command mode的提示字符;-s,-,--quiet或——silent:不执行开启文件时的检查功能;--help:显示帮助;--version:显示版本信息。 参数文件:待编辑的文件。

2019-09-29
01latex编译原理
latex 概念1 tex语言介绍Tex是一种语言类型。同时其也是一种排版引擎。基本的TeX系统只有300多个元命令 (primitive) ,十分精悍,但是很难读懂。 tex语言使用流程 语言格式.tex -> 编译程序tex/etex/latex -> .dvi -> 排版程序pdfTex/PdfLatex -> .Pdf tex语言格式分类 Plain Tex是一种语言格式。最小宏集 LaTeX也是一种语言格式。常见宏集合 ConTeXt:另一种常见的格式。另一种常见宏集合 分别由Tex语言中不同的宏包定义的语言格式 2 tex编译排版介绍tex语言编译工具 tex命令是用来编译Plain Tex书写的.tex文件生成.dvi文件程序。 etex命令是用来编译Plain Tex书写的.tex文件生成.dvi文件程序。 latex命令用来编译使用LaTeX语言写的.tex文件生成为.dvi文件程序。 tex语言排版工具dvipdfmx程序用来对dvi文件进行排版生成pdf文件。 tex语言编译排版工具 用来将tex...

2021-03-22
40 Pytorch分布式概述
PyTorch 分布式概述 原文:https://pytorch.org/tutorials/beginner/dist_overview.html 作者:Shen Li 这是torch.distributed包的概述页面。 由于在不同位置添加了越来越多的文档,示例和教程,因此不清楚要针对特定问题咨询哪个文档或教程,或者阅读这些内容的最佳顺序是什么。 该页面的目的是通过将文档分类为不同的主题并简要描述每个主题来解决此问题。 如果这是您第一次使用 PyTorch 构建分布式训练应用,建议使用本文档导航至最适合您的用例的技术。 简介从 PyTorch v1.6.0 开始,torch.distributed中的功能可以分为三个主要组件: 分布式数据并行训练(DDP)是一种广泛采用的单程序多数据训练范例。 使用 DDP,可以在每个流程上复制模型,并且每个模型副本都将获得一组不同的输入数据样本。 DDP 负责梯度通信,以保持模型副本同步,并使其与梯度计算重叠,以加快训练速度。 基于 RPC 的分布式训练(RPC)开发来支持无法适应数据并行训练的常规训练结构,例如分布式管道并行性,参...

2022-04-18
html5-introduce
HTML5 简介HTML5 是 HTML 标准的下一个重要版本,用来替代 HTML 4.01,XHTML 1.0 以及 XHTML 1.1。HTML5 也是一种在万维网上构建和呈现内容的标准。 HTML5 是万维网联盟(W3C)和网页超文本技术工作小组(WHATWG)合作的产物。 HTML5 是近十年来 Web 开发标准最巨大的飞跃。HTML5 并非仅仅用来表示 Web 内容,它将 Web 带入一个成熟的应用平台,在 HTML5 平台上,视频、音频、图象、动画,以及同电脑的交互都被标准化。 HTML5 引入了许多新元素和属性帮助我们构建现代化的网站。下面是 HTML5 引入的主要特性: 新的语义化元素: 比如 <header>,<footer> 和 <section>。 表单 2.0: 改进了 HTML Web 表单,为 <input> 标签引入了一些新的属性。 持久的本地存储: 为了不通过第三方插件实现。 WebSocket: 用于 Web 应用程序的下一代双向通信技术。 服务器推送事件: HTML5 引入了从 Web 服务器到 ...
2021-06-17
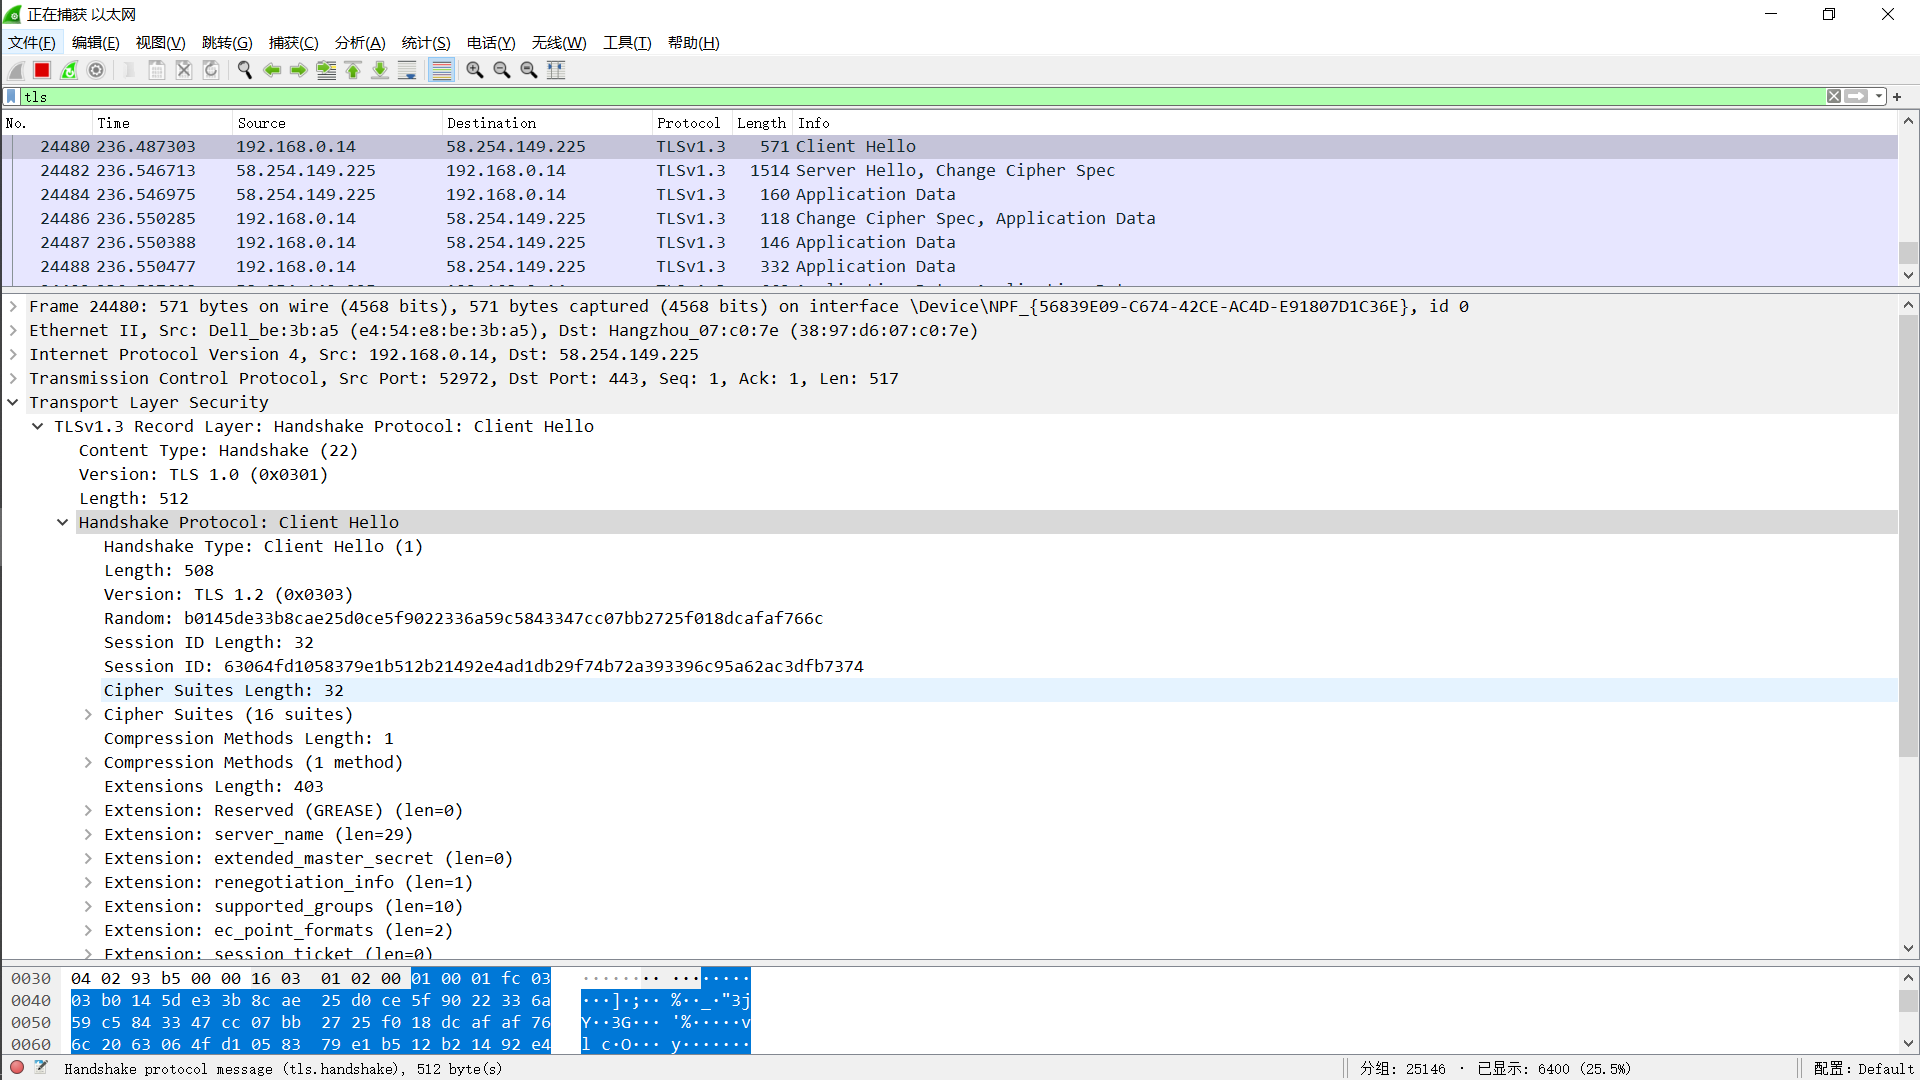
5 TLS实验
TLS1.3实验 主要包括两部分实验 TLS协议数据内容 TLS协议交互过程 TLS1.3数据内容实验截图 client hello server hello client change cipher spec & client data server data 证书实例 client hello TLSrecordlayer包括content type,TLS version,length。包裹的TLS handshake protocol Handshake protocol包括 handshake type length version random session id length session id(通过session ID判断是否是同一个会话) cipher suits length cipher suits compress method length compress method extensions & extension length extension reserved extension server_n...


