
barb_demo
倒勾图示例
倒勾图的示例:
1 | import matplotlib.pyplot as plt |


参考
此示例中显示了以下函数,方法和类的使用:
1 | import matplotlib |
下载这个示例
本博客所有文章除特别声明外,均采用 CC BY-NC-SA 4.0 许可协议。转载请注明来源 Estom的博客!
相关推荐
2021-03-20
16
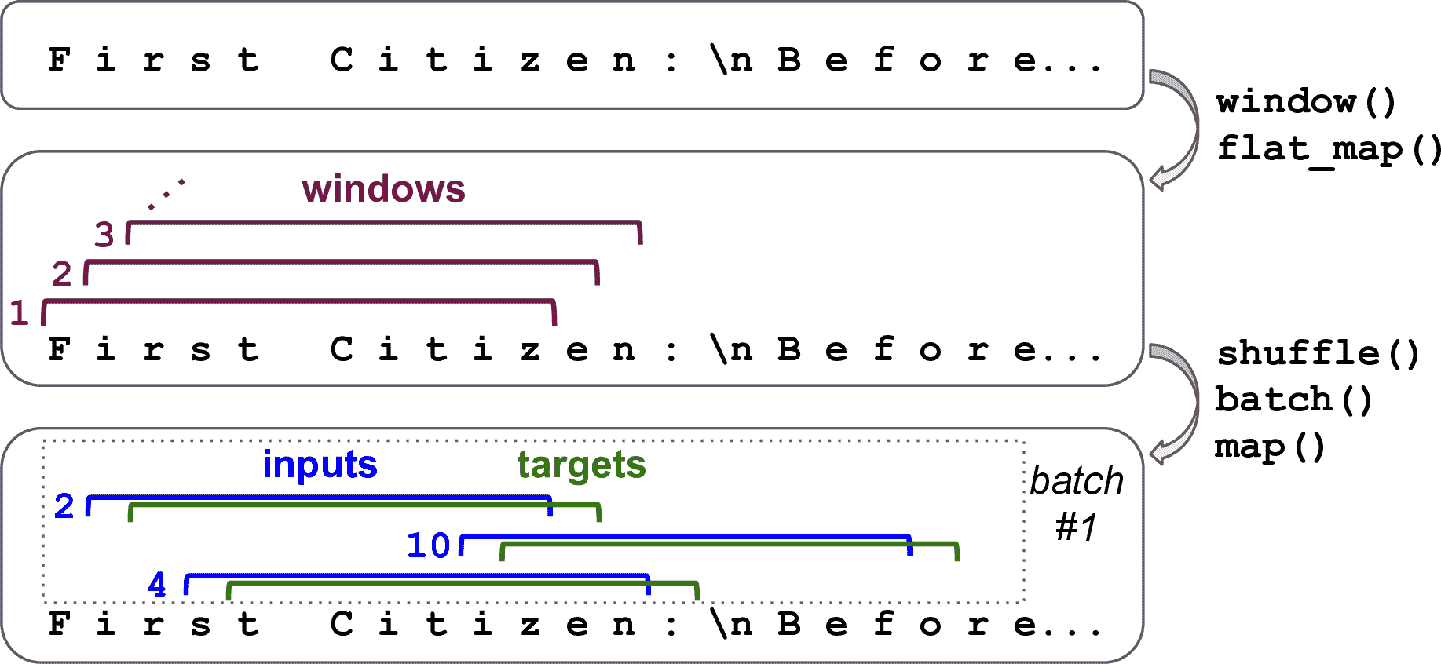
# 十六、使用 RNN 和注意力机制进行自然语言处理 > 译者:[@SeanCheney](https://www.jianshu.com/u/130f76596b02) 当阿兰·图灵在 1950 年设计[图灵机](https://links.jianshu.com/go?to=http%3A%2F%2Fcogprints.org%2F499%2F1%2Fturing.html)时,他的目标是用人的智商来衡量机器。他本可以用其它方法来测试,比如看图识猫、下棋、作曲或逃离迷宫,但图灵选择了一个语言任务。更具体的,他设计了一个聊天机器人,试图迷惑对话者将其当做真人。这个测试有明显的缺陷:一套硬编码的规则可以愚弄粗心人(比如,机器可以针对一些关键词,做出预先定义的模糊响应;机器人可以假装开玩笑或喝醉;或者可以通过反问侥幸过关),忽略了人类的多方面的智力(比如非语言交流,比如面部表情,或是学习动手任务)。但图灵测试强调了一个事实,语言能力是智人最重要的认知能力。我们能创建一台可以读写自然语言的机器吗? 自然语言处理的常用方法是循环神经网络。所以接下来会从字符 RNN 开始(...

2020-09-26
fig_axes_customize_simple
简单的图轴自定义自定义简单绘图的背景,标签和刻度。 1import matplotlib.pyplot as plt 用 plt.figure 创建一个 matplotlib.figure.Figure 实例 12345678910111213141516171819202122fig = plt.figure()rect = fig.patch # a rectangle instancerect.set_facecolor('lightgoldenrodyellow')ax1 = fig.add_axes([0.1, 0.3, 0.4, 0.4])rect = ax1.patchrect.set_facecolor('lightslategray')for label in ax1.xaxis.get_ticklabels(): # label is a Text instance label.set_color('red') label.set_rotation(45) label.set...

2020-09-26
spy_demos
Spy 演示绘制数组的稀疏模式。 1234567891011121314151617181920import matplotlib.pyplot as pltimport numpy as npfig, axs = plt.subplots(2, 2)ax1 = axs[0, 0]ax2 = axs[0, 1]ax3 = axs[1, 0]ax4 = axs[1, 1]x = np.random.randn(20, 20)x[5, :] = 0.x[:, 12] = 0.ax1.spy(x, markersize=5)ax2.spy(x, precision=0.1, markersize=5)ax3.spy(x)ax4.spy(x, precision=0.1)plt.show() 参考此示例中显示了以下函数,方法和类的使用: 123import matplotlibmatplotlib.axes.Axes.spymatplotlib.pyplot.spy 下载这个示例 下载python源码: spy_demos.py 下载Jupyter notebook: spy_de...

2020-09-26
triinterp_demo
Triinterp 演示从三角网格到四边形网格的插值。 1234567891011121314151617181920212223242526272829303132333435363738394041424344454647484950515253import matplotlib.pyplot as pltimport matplotlib.tri as mtriimport numpy as np# Create triangulation.x = np.asarray([0, 1, 2, 3, 0.5, 1.5, 2.5, 1, 2, 1.5])y = np.asarray([0, 0, 0, 0, 1.0, 1.0, 1.0, 2, 2, 3.0])triangles = [[0, 1, 4], [1, 2, 5], [2, 3, 6], [1, 5, 4], [2, 6, 5], [4, 5, 7], [5, 6, 8], [5, 8, 7], [7, 8, 9]]triang = mtri.Triangulation(x, y, triang...
2021-03-20
5 模型后处理
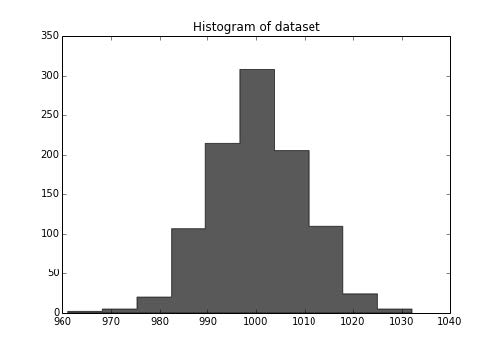
第五章 模型后处理 作者:Trent Hauck 译者:飞龙 协议:CC BY-NC-SA 4.0 5.1 K-fold 交叉验证这个秘籍中,我们会创建交叉验证,它可能是最重要的模型后处理验证练习。我们会在这个秘籍中讨论 k-fold 交叉验证。有几种交叉验证的种类,每个都有不同的随机化模式。K-fold 可能是一种最熟知的随机化模式。 准备我们会创建一些数据集,之后在不同的在不同的折叠上面训练分类器。值得注意的是,如果你可以保留一部分数据,那是最好的。例如,我们拥有N = 1000的数据集,如果我们保留 200 个数据点,之后使用其他 800 个数据点之间的交叉验证,来判断最佳参数。 工作原理首先,我们会创建一些伪造数据,之后测试参数,最后,我们会看看结果数据集的大小。 1234>>> N = 1000 >>> holdout = 200>>> from sklearn.datasets import make_regression >>> X, y = make_regression(1000...

2021-03-20
37
5. 数据集转换scikit-learn 提供了一个用于转换数据集的库, 它也许会 clean(清理)(请参阅 预处理数据), reduce(减少)(请参阅 无监督降维), expand(扩展)(请参阅 内核近似)或 generate(生成)(请参阅 特征提取) feature representations(特征表示). 像其它预估计一样, 它们由具有 fit 方法的类来表示, 该方法从训练集学习模型参数(例如, 归一化的平均值和标准偏差)以及transform 方法将该转换模型应用于不可见数据. 同时 fit_transform 可以更方便和有效地建模与转换训练数据. 将 Pipeline(管道)和 FeatureUnion(特征联合): 合并的评估器 中 transformers(转换)使用并行的或者串联的方式合并到一起. 成对的矩阵, 类别和核函数 涵盖将特征空间转换为 affinity matrices(亲和矩阵), 而 预测目标 (y) 的转换 考虑在 scikit-learn 中使用目标空间的转换(例如. 标签分类). 5.1. Pipeline(管道)和 Fea...


