
image_masked
图像掩码
显示与掩码数组输入和范围以外的颜色。
第二个子图说明了如何使用边界规范来获得填充轮廓效果。
1 | from copy import copy |

参考
下面的示例演示了以下函数和方法的使用:
1 | import matplotlib |
下载这个示例
本博客所有文章除特别声明外,均采用 CC BY-NC-SA 4.0 许可协议。转载请注明来源 Estom的博客!
相关推荐

2020-09-26
tricontour_demo
Tricontour 演示非结构化三角形网格的等高线图。 123import matplotlib.pyplot as pltimport matplotlib.tri as triimport numpy as np 在不指定三角形的情况下创建三角剖分会导致点的Delaunay三角剖分。 123456789101112131415161718192021# First create the x and y coordinates of the points.n_angles = 48n_radii = 8min_radius = 0.25radii = np.linspace(min_radius, 0.95, n_radii)angles = np.linspace(0, 2 * np.pi, n_angles, endpoint=False)angles = np.repeat(angles[..., np.newaxis], n_radii, axis=1)angles[:, 1::2] += np.pi / n_anglesx = (radii * np.cos(an...
2020-10-14
01神经网络基础
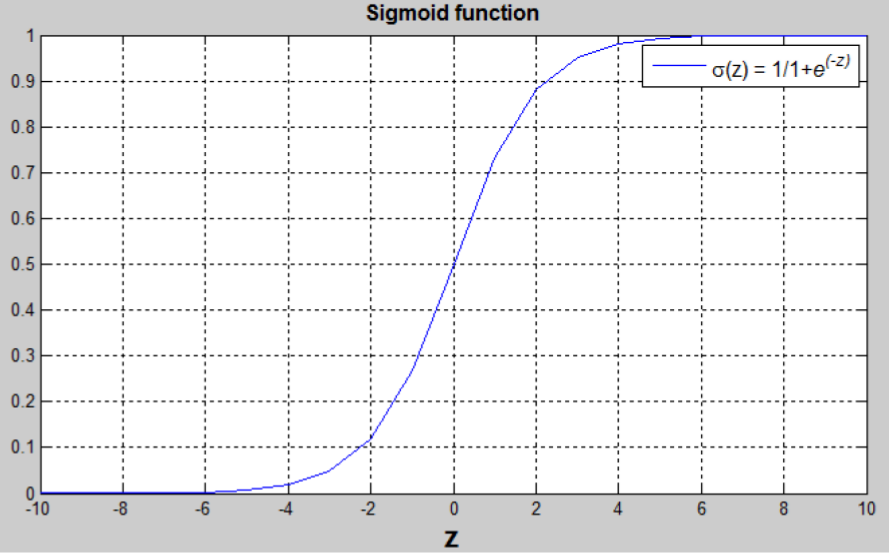
神经网络基础 介绍神经网络的编程基础。看完视频,在总结这一部分。每一个视频,完成开始做笔记。 1 识别图片上的猫问题定义 场景定义:监督学习。图像识别领域。非结构化数据输入。 问题定义:分类问题。 算法定义:logistics回归。 问题描述 输入的特征向量:$x \in R^{n_x}$,其中 ${n_x}$是特征数量; 输出的标签,用于训练的标签:$y \in 0,1$ 训练集:${(x^{(1)},y^{(1)}),\dots,(x^{(m)},y^{(m)})}$紧凑矩阵表示训练集。约定使用列向量。 2 Logistic回归模型 Logistic 回归是一个用于二分分类的算法。 模型定义-假设函数 权重:$w \in R^{n_x}$ 偏置: $b \in R$ 输出:$\hat{y} = \sigma(w^Tx+b)$ Sigmoid 函数:$$s = \sigma(w^Tx+b) = \sigma(z) = \frac{1}{1+e^{-z}}$$ 将 $w^Tx+b$ 约束在 [0, 1] 间...

2020-09-26
mathtext_asarray
数学文本图像作为numpy数组从LaTeX字符串制作图像。 1234567891011121314151617181920import matplotlib.mathtext as mathtextimport matplotlib.pyplot as pltimport matplotlibmatplotlib.rc('image', origin='upper')parser = mathtext.MathTextParser("Bitmap")parser.to_png('test2.png', r'$\left[\left\lfloor\frac{5}{\frac{\left(3\right)}{4}} ' r'y\right)\right]$', color='green', fonts...

2020-09-26
spy_demos
Spy 演示绘制数组的稀疏模式。 1234567891011121314151617181920import matplotlib.pyplot as pltimport numpy as npfig, axs = plt.subplots(2, 2)ax1 = axs[0, 0]ax2 = axs[0, 1]ax3 = axs[1, 0]ax4 = axs[1, 1]x = np.random.randn(20, 20)x[5, :] = 0.x[:, 12] = 0.ax1.spy(x, markersize=5)ax2.spy(x, precision=0.1, markersize=5)ax3.spy(x)ax4.spy(x, precision=0.1)plt.show() 参考此示例中显示了以下函数,方法和类的使用: 123import matplotlibmatplotlib.axes.Axes.spymatplotlib.pyplot.spy 下载这个示例 下载python源码: spy_demos.py 下载Jupyter notebook: spy_de...

2020-09-26
color_by_yvalue
通过y-value绘制颜色使用掩码数组以y值绘制具有不同颜色的线。 1234567891011121314151617import numpy as npimport matplotlib.pyplot as pltt = np.arange(0.0, 2.0, 0.01)s = np.sin(2 * np.pi * t)upper = 0.77lower = -0.77supper = np.ma.masked_where(s < upper, s)slower = np.ma.masked_where(s > lower, s)smiddle = np.ma.masked_where(np.logical_or(s < lower, s > upper), s)fig, ax = plt.subplots()ax.plot(t, smiddle, t, slower, t, supper)plt.show() 参考此示例中显示了以下函数,方法,类和模块的使用: 123import matplotlibmatplotlib.axes.Axes.plo...

2020-09-26
boxplot_demo_pyplot
Boxplot 演示boxplot 的代码示例。 123456789101112import numpy as npimport matplotlib.pyplot as plt# Fixing random state for reproducibilitynp.random.seed(19680801)# fake up some dataspread = np.random.rand(50) * 100center = np.ones(25) * 50flier_high = np.random.rand(10) * 100 + 100flier_low = np.random.rand(10) * -100data = np.concatenate((spread, center, flier_high, flier_low)) 123fig1, ax1 = plt.subplots()ax1.set_title('Basic Plot')ax1.boxplot(data) 123fig2, ax2 = plt.subplots()ax2.set...


