
multi_image
多重图像
用单一的彩色地图、标准和颜色条制作一组图像。
1 | from matplotlib import colors |

参考
本例中显示了以下函数、方法和类的使用:
1 | import matplotlib |
下载这个示例
https://estom.github.io/2020/09/26/Python/matplotlab/gallery/images_contours_and_fields/multi_image/
本博客所有文章除特别声明外,均采用 CC BY-NC-SA 4.0 许可协议。转载请注明来源 Estom的博客!
相关推荐

2020-09-26
errorbars_and_boxes
使用PatchCollection在误差图中创建箱型图在这个例子中,我们通过在x方向和y方向上添加由条形极限定义的矩形块来拼写一个非常标准的误差条形图。为此,我们必须编写自己的自定义函数 make_error_boxes。仔细检查此函数将揭示matplotlib编写函数的首选模式: an Axes object is passed directly to the function the function operates on the Axes methods directly, not through the pyplot interface plotting kwargs that could be abbreviated are spelled out for better code readability in the future (for example we use facecolor instead of fc) the artists returned by the Axes plotting methods are then returned by the...

2021-05-09
81 API-torch.nn
torch.nn1 Containers2 Convolution Layers3 Pooling layers4 Padding Layers5 Non-linear Activations (weighted sum, nonlinearity)6 Non-linear Activations (other)7 Normalization Layers8 Recurrent Layers9 Transformer Layers10 Linear Layers11 Dropout Layers12 Sparse Layers13 Distance Functions14 Loss Functions损失函数nn.L1Loss创建一个标准来测量输入中每个元素之间的平均绝对误差(MAE) XX 和目标 ÿÿ 。 nn.MSELoss创建一个标准来测量输入中每个元素之间的均方误差(L2平方的平方) XX 和目标 ÿÿ 。 nn.CrossEntropyLoss这一标准联合收割机LogSoftmax,并NLLLoss在一个单独的类。 nn.CTCLoss连接主义者的时间分类损失。 nn...

2020-09-26
demo_constrained_layout
使用约束布局调整轴的大小约束布局尝试调整图中子图的大小,以使轴对象和轴上的标签之间不会重叠。 有关详细信息,请参阅 “约束布局指南”;有关替代方法,请参阅 “严格布局” 指南。 12345678910import matplotlib.pyplot as pltimport itertoolsimport warningsdef example_plot(ax): ax.plot([1, 2]) ax.set_xlabel('x-label', fontsize=12) ax.set_ylabel('y-label', fontsize=12) ax.set_title('Title', fontsize=14) 如果我们不使用constrained_layout,则标签会重叠轴 1234fig, axs = plt.subplots(nrows=2, ncols=2, constrained_layout=False)for ax in axs.flatten(): example_pl...
2021-03-20
16
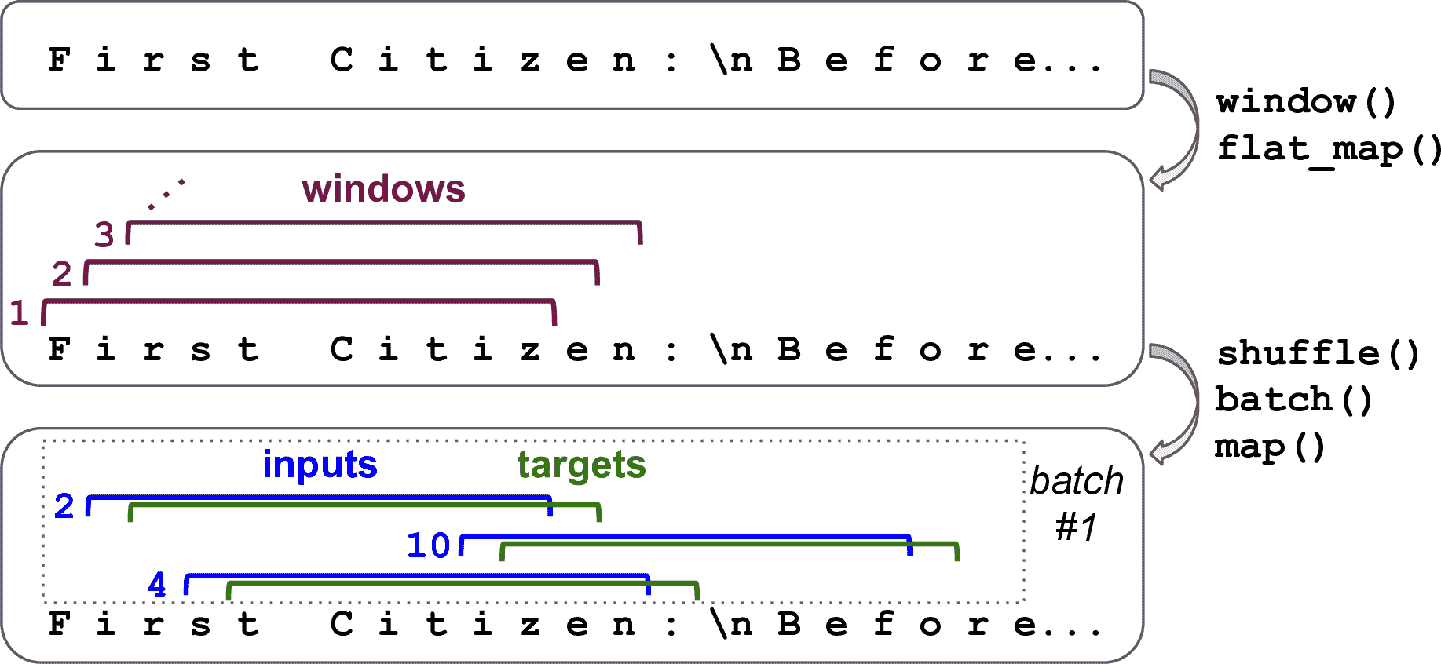
# 十六、使用 RNN 和注意力机制进行自然语言处理 > 译者:[@SeanCheney](https://www.jianshu.com/u/130f76596b02) 当阿兰·图灵在 1950 年设计[图灵机](https://links.jianshu.com/go?to=http%3A%2F%2Fcogprints.org%2F499%2F1%2Fturing.html)时,他的目标是用人的智商来衡量机器。他本可以用其它方法来测试,比如看图识猫、下棋、作曲或逃离迷宫,但图灵选择了一个语言任务。更具体的,他设计了一个聊天机器人,试图迷惑对话者将其当做真人。这个测试有明显的缺陷:一套硬编码的规则可以愚弄粗心人(比如,机器可以针对一些关键词,做出预先定义的模糊响应;机器人可以假装开玩笑或喝醉;或者可以通过反问侥幸过关),忽略了人类的多方面的智力(比如非语言交流,比如面部表情,或是学习动手任务)。但图灵测试强调了一个事实,语言能力是智人最重要的认知能力。我们能创建一台可以读写自然语言的机器吗? 自然语言处理的常用方法是循环神经网络。所以接下来会从字符 RNN 开始(...

2020-09-26
tricontour_smooth_user
Tricontour Smooth User使用 matplotlib.tri.UniformTriRefiner 在用户定义的三角形网格上演示高分辨率三角形。 12345678910111213141516171819202122232425262728293031323334353637383940414243444546474849505152535455565758596061626364656667686970import matplotlib.tri as triimport matplotlib.pyplot as pltimport matplotlib.cm as cmimport numpy as np#-----------------------------------------------------------------------------# Analytical test function#-----------------------------------------------------------------------------...

2020-09-26
plot_streamplot
流图流图或流线图用于显示2D矢量场。此示例显示了 streamplot() 函数的一些功能: 沿着流线改变颜色。 改变流线的密度。 沿流线改变线宽。 控制流线的起点。 流线跳过蒙面区域和NaN值。 1234567891011121314151617181920212223242526272829303132333435363738394041424344454647484950515253545556575859import numpy as npimport matplotlib.pyplot as pltimport matplotlib.gridspec as gridspecw = 3Y, X = np.mgrid[-w:w:100j, -w:w:100j]U = -1 - X**2 + YV = 1 + X - Y**2speed = np.sqrt(U*U + V*V)fig = plt.figure(figsize=(7, 9))gs = gridspec.GridSpec(nrows=3, ncols=2, height_ratios=[1, 1, 2])# ...


