
shading_example
着色示例
显示如何制作阴影浮雕图的示例,如Mathematica (http://reference.wolfram.com/mathematica/ref/ReliefPlot.html)或通用映射工具(https://gmt.soest.hawaii.edu/)
1 | import numpy as np |


参考
本例中显示了以下函数、方法和类的使用:
1 | import matplotlib |
下载这个示例
本博客所有文章除特别声明外,均采用 CC BY-NC-SA 4.0 许可协议。转载请注明来源 Estom的博客!
相关推荐

2020-09-26
quad_bezier
Bezier曲线此示例展示 PathPatch 对象以创建Bezier多曲线路径修补程序。 1234567891011121314151617import matplotlib.path as mpathimport matplotlib.patches as mpatchesimport matplotlib.pyplot as pltPath = mpath.Pathfig, ax = plt.subplots()pp1 = mpatches.PathPatch( Path([(0, 0), (1, 0), (1, 1), (0, 0)], [Path.MOVETO, Path.CURVE3, Path.CURVE3, Path.CLOSEPOLY]), fc="none", transform=ax.transData)ax.add_patch(pp1)ax.plot([0.75], [0.25], "ro")ax.set_title('The red point should be on the...

2020-09-26
fig_axes_customize_simple
简单的图轴自定义自定义简单绘图的背景,标签和刻度。 1import matplotlib.pyplot as plt 用 plt.figure 创建一个 matplotlib.figure.Figure 实例 12345678910111213141516171819202122fig = plt.figure()rect = fig.patch # a rectangle instancerect.set_facecolor('lightgoldenrodyellow')ax1 = fig.add_axes([0.1, 0.3, 0.4, 0.4])rect = ax1.patchrect.set_facecolor('lightslategray')for label in ax1.xaxis.get_ticklabels(): # label is a Text instance label.set_color('red') label.set_rotation(45) label.set...
2021-03-20
5
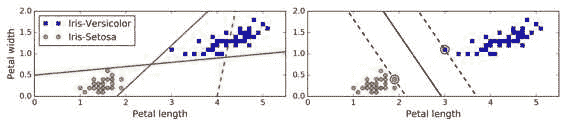
五、支持向量机 译者:@QiaoXie 校对者:@飞龙、@PeterHo、@yanmengk、@YuWang 支持向量机(SVM)是个非常强大并且有多种功能的机器学习模型,能够做线性或者非线性的分类,回归,甚至异常值检测。机器学习领域中最为流行的模型之一,是任何学习机器学习的人必备的工具。SVM 特别适合应用于复杂但中小规模数据集的分类问题。 本章节将阐述支持向量机的核心概念,怎么使用这个强大的模型,以及它是如何工作的。 线性支持向量机分类SVM 的基本思想能够用一些图片来解释得很好,图 5-1 展示了我们在第 4 章结尾处介绍的鸢尾花数据集的一部分。这两个种类能够被非常清晰,非常容易的用一条直线分开(即线性可分的)。左边的图显示了三种可能的线性分类器的判定边界。其中用虚线表示的线性模型判定边界很差,甚至不能正确地划分类别。另外两个线性模型在这个数据集表现的很好,但是它们的判定边界很靠近样本点,在新的数据上可能不会表现的很好。相比之下,右边图中 SVM 分类器的判定边界实线,不仅分开了两种类别,而且还尽可能地远离了最靠近的训练数据点。你可以认为 SVM 分类器在两种类别之间保持...
2021-03-20
12
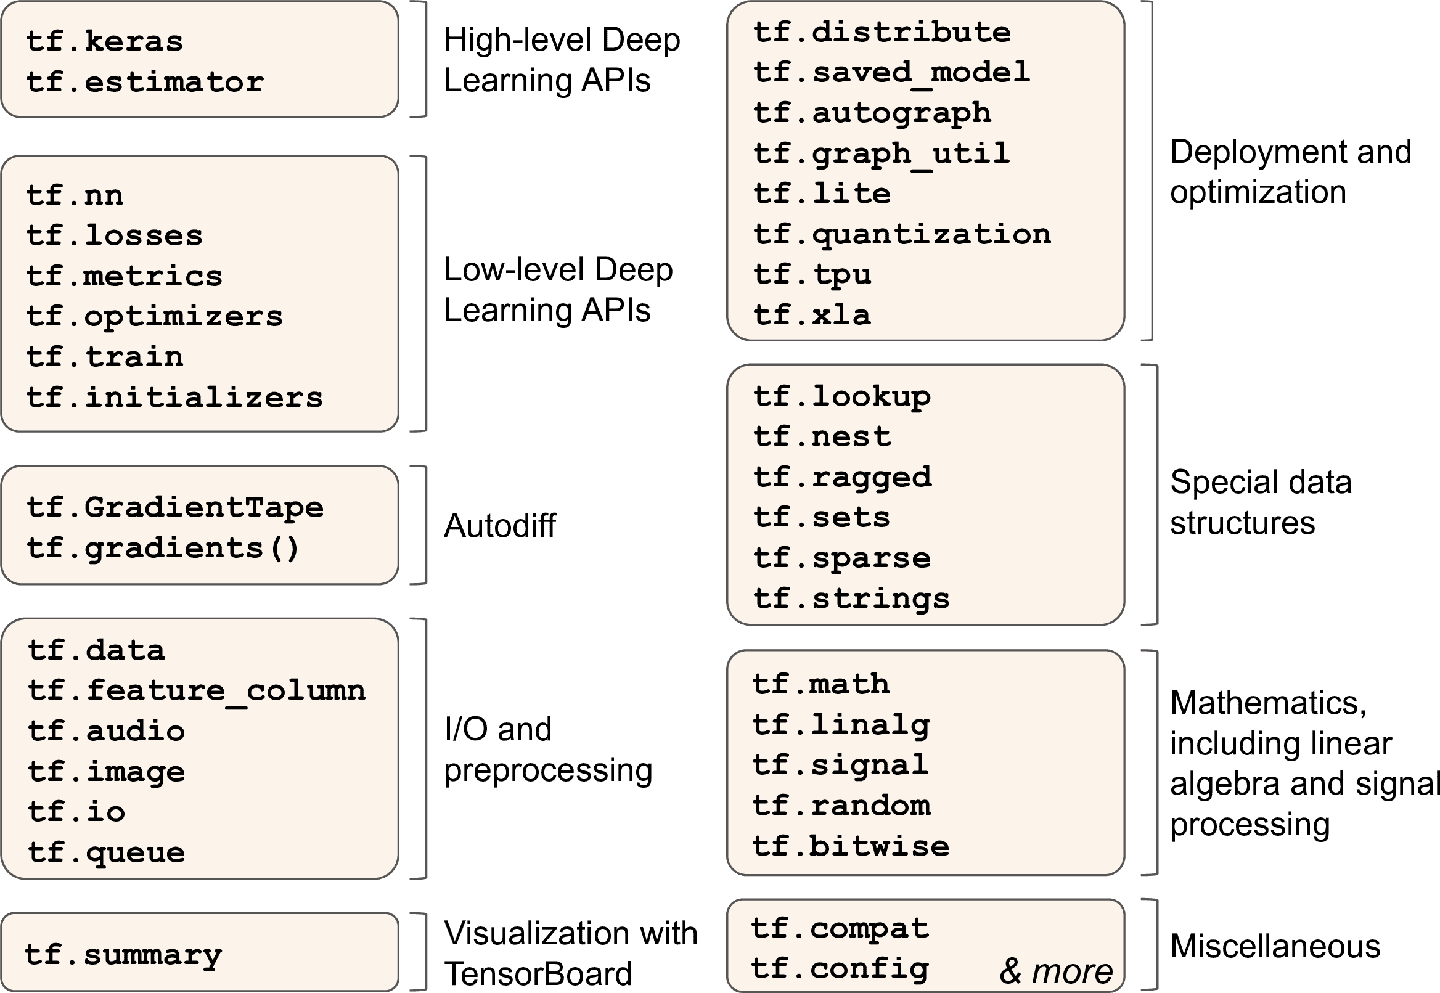
十二、使用 TensorFlow 自定义模型并训练 译者:@SeanCheney 目前为止,我们只是使用了 TensorFlow 的高级 API —— tf.keras,它的功能很强大:搭建了各种神经网络架构,包括回归、分类网络、Wide & Deep 网络、自归一化网络,使用了各种方法,包括批归一化、丢弃和学习率调度。事实上,你在实际案例中 95% 碰到的情况只需要tf.keras就足够了(和tf.data,见第 13 章)。现在来深入学习 TensorFlow 的低级 Python API。当你需要实现自定义损失函数、自定义标准、层、模型、初始化器、正则器、权重约束时,就需要低级 API 了。甚至有时需要全面控制训练过程,例如使用特殊变换或对约束梯度时。这一章就会讨论这些问题,还会学习如何使用 TensorFlow 的自动图生成特征提升自定义模型和训练算法。首先,先来快速学习下 TensorFlow。 笔记:TensorFlow 2.0(beta)是 2019 年六月发布的,相比前代更易使用。本书第一版使用的是 TF 1,这一版使用的是 TF 2。 Tensor...
2020-09-27
4.朴素贝叶斯
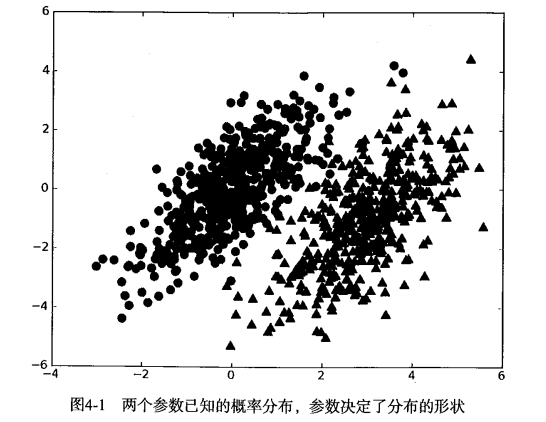
第4章 基于概率论的分类方法: 朴素贝叶斯1 朴素贝叶斯 概述贝叶斯分类是一类分类算法的总称,这类算法均以贝叶斯定理为基础,故统称为贝叶斯分类。本章首先介绍贝叶斯分类算法的基础——贝叶斯定理。最后,我们通过实例来讨论贝叶斯分类的中最简单的一种: 朴素贝叶斯分类。 2 贝叶斯理论 & 条件概率贝叶斯理论 我们现在有一个数据集,它由两类数据组成,数据分布如下图所示: 我们现在用 p1(x,y) 表示数据点 (x,y) 属于类别 1(图中用圆点表示的类别)的概率,用 p2(x,y) 表示数据点 (x,y) 属于类别 2(图中三角形表示的类别)的概率,那么对于一个新数据点 (x,y),可以用下面的规则来判断它的类别: 如果 p1(x,y) > p2(x,y) ,那么类别为1 如果 p2(x,y) > p1(x,y) ,那么类别为2 也就是说,我们会选择高概率对应的类别。这就是贝叶斯决策理论的核心思想,即选择具有最高概率的决策。 条件概率 有一个装了 7 块石头的罐子,其中 3 块是白色的,4 块是黑色的。如果从罐子中随机取出一块石头,那么是白色石头的...

2021-03-20
1
1. 监督学习 1.1. 广义线性模型 1.1.1. 普通最小二乘法 1.1.2. 岭回归 1.1.3. Lasso 1.1.4. 多任务 Lasso 1.1.5. 弹性网络 1.1.6. 多任务弹性网络 1.1.7. 最小角回归 1.1.8. LARS Lasso 1.1.9. 正交匹配追踪法(OMP) 1.1.10. 贝叶斯回归 1.1.11. logistic 回归 1.1.12. 随机梯度下降, SGD 1.1.13. Perceptron(感知器) 1.1.14. Passive Aggressive Algorithms(被动攻击算法) 1.1.15. 稳健回归(Robustness regression): 处理离群点(outliers)和模型错误 1.1.16. 多项式回归:用基函数展开线性模型 1.2. 线性和二次判别分析 1.2.1. 使用线性判别分析来降维 1.2.2. LDA 和 QDA 分类器的数学公式 1.2.3. LDA 的降维数学公式 1.2.4. Shrinkage(收缩) 1.2.5. 预估算法 1.3. 内核岭回归 1.4. 支持向量...


