
eventcollection_demo
绘制事件集的示例
绘制两条曲线,然后使用EventCollections标记每条曲线的相应轴上的x和y数据点的位置
 ;
;
1 | import matplotlib.pyplot as plt |
下载这个示例
本博客所有文章除特别声明外,均采用 CC BY-NC-SA 4.0 许可协议。转载请注明来源 Estom的博客!
相关推荐
2021-04-08
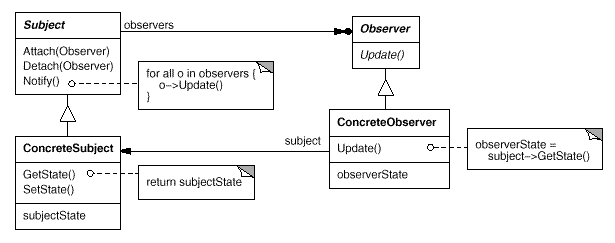
4.7 观察者
观察者模式别名 Dependency Publish-Subscribe 观察者模式好牛啊,在不同的代码层次有这不同的名称但是大同小异。 在java代码层就是观察着模式 在socket网络编程、IO编程中(netty、springWebFlux、sofarpc)就是Reactor模式 在操作系统中就是IO多路复用的一种策略 在UI框架中就是Listener,事件监听机制和响应机制 在Spring框架中也有事件监听模型。 在web网站开发中,被称为响应式编程。服务发现机制。以下并不是观察者模式的范畴,是一种更加宏观的机制,可能使用了观察者模式去发现。 javaSPI。服务提供者接口 在微服务中就是注册中心的发布订阅过程。发布者订阅者、提供者消费者。 在消息中间件中就是发布订阅模式。https://juejin.cn/post/6993999863159455752 意图 定义对象间的一种一对多的依赖关系,当一个对象的状态发生改变时,所有依赖于它的对象都得到通知并被自动更新。 结构 参与者 Subject Subject 知道它的 Observer。可以有任意多个 O...

2020-09-26
looking_glass
镜子例如,使用鼠标事件模拟用于检查数据的镜子。 12345678910111213141516171819202122232425262728293031323334353637383940414243444546474849505152import numpy as npimport matplotlib.pyplot as pltimport matplotlib.patches as patches# Fixing random state for reproducibilitynp.random.seed(19680801)x, y = np.random.rand(2, 200)fig, ax = plt.subplots()circ = patches.Circle((0.5, 0.5), 0.25, alpha=0.8, fc='yellow')ax.add_patch(circ)ax.plot(x, y, alpha=0.2)line, = ax.plot(x, y, alpha=1.0, clip_path=circ)ax.set_titl...

2020-09-26
index
事件处理Matplotlib支持使用GUI中立事件模型进行事件处理,因此您可以连接到Matplotlib事件,而无需了解Matplotlib最终将插入哪个用户界面。 这有两个好处:你编写的代码将更加可移植,Matplotlib事件就像数据坐标空间和事件发生在哪些轴之类的东西,所以你不必混淆低级转换细节来自画布空间到数据空间。还包括对象拾取示例。

2025-09-03
01 创建Pod会经过哪些步骤
在 Kubernetes(简称 K8s)集群中,直接执行 kubectl apply -f pod.yaml 来部署一个 Pod 时,会触发集群的一系列自动化流程。这是一个典型的声明式操作,用户只需描述 Pod 的期望状态(通过 YAML 文件),K8s 控制平面和节点组件会协同工作,将其转化为实际运行状态。整个过程体现了 K8s 的核心原理:声明式 API、期望状态驱动(Desired State vs. Actual State)、组件间松耦合协作(通过 API Server 和 etcd 实现状态同步),以及自愈机制(如重试和健康检查)。下面,我结合 K8s 原理,从请求提交到 Pod 运行就绪,逐阶段详细拆解整个流程。 阶段 1:用户请求提交与 API Server 处理用户通过 kubectl apply 命令提交 Pod 的 YAML 配置(包含 metadata 如名称、命名空间;spec 如容器镜像、资源需求、端口等)。kubectl 会解析 YAML,确保它符合 K8s 的 Pod 资源规范(v1 Pod API),然后转换为 JSON 格式的 HTTP 请求发...

2022-12-04
06-事件监听
# 1. v-on的基本使用 在前面的计数器案例中使用了`v-on:click`监听单击事件。这里在回顾一下: 123456789101112131415161718192021222324252627282930313233343536<!DOCTYPE html><html lang="en"><head> <meta charset="UTF-8"> <meta name="viewport" content="width=device-width, initial-scale=1.0"> <meta http-equiv="X-UA-Compatible" content="ie=edge"> <script src="https://cdn.jsdelivr.net/npm/vue@2.6.10/dist/vue.js"></...

2021-09-07
basics_of_libuv
Basics of libuvlibuv强制使用异步和事件驱动的编程风格。它的核心工作是提供一个event-loop,还有基于I/O和其它事件通知的回调函数。libuv还提供了一些核心工具,例如定时器,非阻塞的网络支持,异步文件系统访问,子进程等。 Event loops在事件驱动编程中,程序会关注每一个事件,并且对每一个事件的发生做出反应。libuv会负责将来自操作系统的事件收集起来,或者监视其他来源的事件。这样,用户就可以注册回调函数,回调函数会在事件发生的时候被调用。event-loop会一直保持运行状态。用伪代码描述如下: 1234while there are still events to process: e = get the next event if there is a callback associated with e: call the callback 举几个事件的例子: 准备好被写入的文件。 包含准备被读取的数据的socket。 超时的定时器。 event-loop最终会被uv_ru...


