
scatter_piecharts
带有饼图标记的散点图
此示例将自定义 ‘饼图’ 作为散点图的标记。
感谢 Manuel Metz 的例子
1 | import numpy as np |

参考
本例中显示了下列函数、方法、类和模块的使用:
1 | import matplotlib |
下载这个示例
本博客所有文章除特别声明外,均采用 CC BY-NC-SA 4.0 许可协议。转载请注明来源 Estom的博客!
相关推荐

2021-03-22
03 Pytorch 实例学习
通过示例学习 PyTorch 1 预热:NumPy 2 PyTorch:张量 3 Autograd 3.1 PyTorch:张量和 Autograd 3.2 PyTorch:定义新的 Autograd 函数 4 nn模块 4.1 PyTorch:nn 4.2 PyTorch:optim 4.3 PyTorch:自定义nn模块 4.4 PyTorch:控制流 + 权重共享 通过示例学习 PyTorchPyTorch 的核心是提供两个主要功能: n 维张量,类似于 NumPy,但可以在 GPU 上运行 用于构建和训练神经网络的自动微分 我们将使用将三阶多项式拟合y = sin(x)的问题作为运行示例。 该网络将具有四个参数,并且将通过使网络输出与实际输出之间的欧几里德距离最小化来进行梯度下降训练,以适应随机数据。 注意 您可以在本页浏览各个示例。 1 预热:NumPy在介绍 PyTorch 之前,我们将首先使用 numpy 实现网络。 Numpy 提供了一个 n 维数组对象,以及许多用于操纵这些数组的函数。 Numpy 是用于科学计算的通用框架。 它对计算图,深度学习或梯...

2020-09-26
color_by_yvalue
通过y-value绘制颜色使用掩码数组以y值绘制具有不同颜色的线。 1234567891011121314151617import numpy as npimport matplotlib.pyplot as pltt = np.arange(0.0, 2.0, 0.01)s = np.sin(2 * np.pi * t)upper = 0.77lower = -0.77supper = np.ma.masked_where(s < upper, s)slower = np.ma.masked_where(s > lower, s)smiddle = np.ma.masked_where(np.logical_or(s < lower, s > upper), s)fig, ax = plt.subplots()ax.plot(t, smiddle, t, slower, t, supper)plt.show() 参考此示例中显示了以下函数,方法,类和模块的使用: 123import matplotlibmatplotlib.axes.Axes.plo...

2021-09-02
3-基本数据类型
3 基本数据类型基本数据类型包括:整型、浮点型、布尔型、字符串。 除以上基本类型之外,还有 数组、切片、结构体、函数、map、通道 等。 3.1 整型3.1.1 整型整型分为:int8、int16、int32、int64 ,以及对应的无符号整型:uint8、uint16、uint32、uint64 其中 unit8 对应其他语言中的 byte 类型;int16 对应 C 语言中的 short 类型;int64 对应 C 语言中的 long 类型。 各数据类型及对应的取值关系如下: 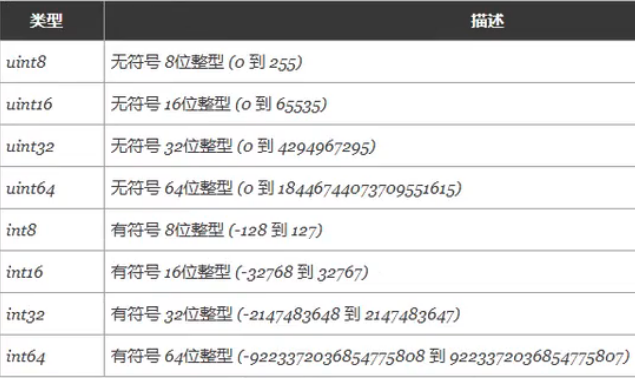 特殊整型: 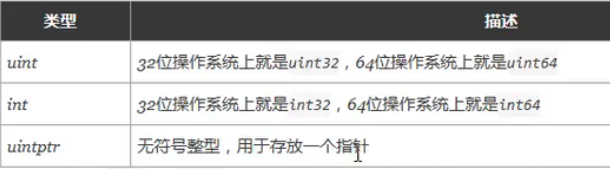 注意: 获取对象的长度时,内建的 len() 函数返回的长度可以根据不同平台的字节长度进行变化。实际使用中,切片或 map 的元素数量等都可以直接使用 int 来表示 。 3.1.2 八进制...

2020-09-26
colormap_reference
Colormap参考Matplotlib附带的色彩映射参考。 通过将 _r 附加到名称(例如,viridis_r),可以获得每个这些颜色映射的反转版本。 请参阅在Matplotlib中选择Colormaps以深入讨论色彩映射,包括colorblind-friendlyliness。 12345678910111213141516171819202122232425262728293031323334353637383940414243444546474849505152535455import numpy as npimport matplotlib.pyplot as pltcmaps = [('Perceptually Uniform Sequential', [ 'viridis', 'plasma', 'inferno', 'magma', 'cividis']), ('Sequential', ...

2020-09-26
line_collection
线段集合使用Matplotlib绘制线条。 LineCollection 允许在图上绘制多条线。 下面我们展示它的一些属性。 12345678910111213141516171819202122232425262728293031323334353637383940import matplotlib.pyplot as pltfrom matplotlib.collections import LineCollectionfrom matplotlib import colors as mcolorsimport numpy as np# In order to efficiently plot many lines in a single set of axes,# Matplotlib has the ability to add the lines all at once. Here is a# simple example showing how it is done.x = np.arange(100)# Here are many sets of y to plot...

2021-03-08
TensorFlow-IO
TensorFlow - IO 在 tf.data 之前,一般使用 QueueRunner,但 QueueRunner 基于 Python 的多线程及队列等,效率不够高,所以 Google发布了tf.data,其基于C++的多线程及队列,彻底提高了效率。所以不建议使用 QueueRunner 了,取而代之,使用 tf.data 模块吧:简单、高效。 preload直接将数据设置为常量,加载到TensorFlow的graph中。 12345678import tensorflow as tfx1 = tf.constant([2,3,4])x2 = tf.constant([4,0,1])y = tf.add(x1,x2)with tf.Session() as sess: print(sess.run(y)) feed_dict使用Python代码获取数据,通过给run()或者eval()函数输入feed_dict参数,传入数据,可以启动运算过程。 1234with tf.Session(): input = tf.placeholder(tf.float32) c...


