
coords_report
坐标报告
覆盖coords的默认报告。

1 | import matplotlib.pyplot as plt |
下载这个示例
本博客所有文章除特别声明外,均采用 CC BY-NC-SA 4.0 许可协议。转载请注明来源 Estom的博客!
相关推荐
2023-11-09
06 Web开发5-原生组件
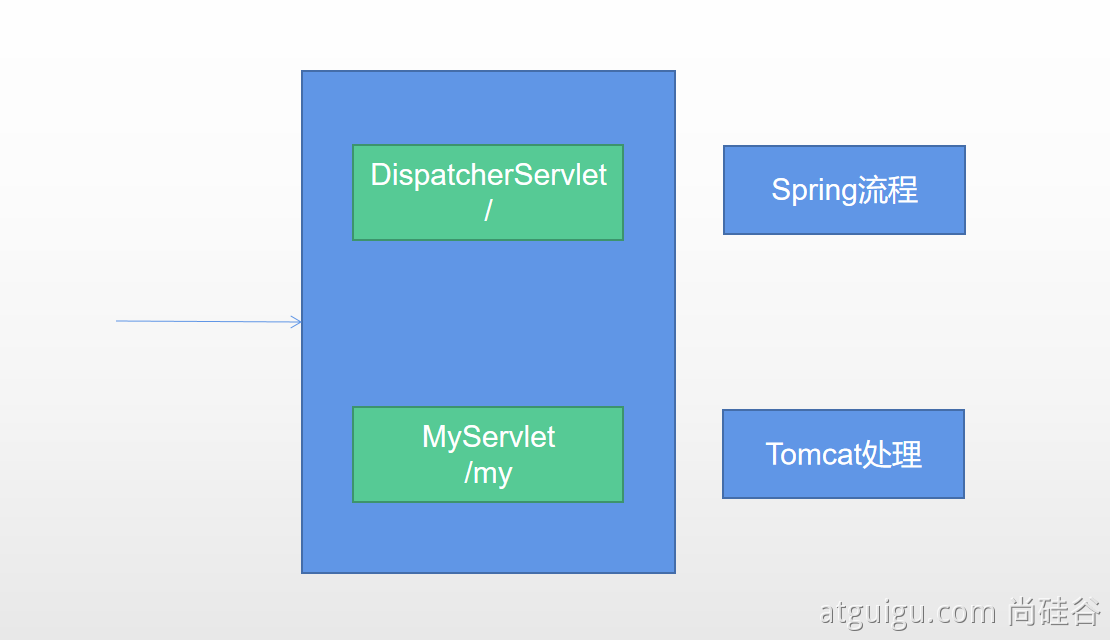
0 概述使用的标准方法 1234@ServletComponentScan(basePackages = "com.atguigu.admin") :指定原生Servlet组件都放在那里@WebServlet(urlPatterns = "/my"):效果:直接响应,没有经过Spring的拦截器?@WebFilter(urlPatterns={"/css/*","/images/*"})@WebListener WebServlet1234567891011@WebServlet(urlPatterns = "/path2/*")public class MyServlet extends HttpServlet { @Override protected void doGet (HttpServletRequest req, HttpServletResponse resp) throws ServletException...

2021-04-12
3 运行调试
编译、运行、调试编译tasktasks.json tasks是终端的一部分。就像在.code-snippets json中配置snippet一样,可以用来提供代码片段。在tasks.json,配置命令执行的脚本。然后使用tasks命令执行。 tasks负责执行一些任务。主要由vscode的脚本提供支持。是vscode用来运行操作系统脚本的工具。 tasks可以在命令列表>tasks:中找到, 其中C/C++插件提供了默认的内容 。 12345678910111213141516171819{ "version": "2.0.0", "tasks": [ { "type": "shell", "label": "C/C++: g++.exe build active file", "command": "C:\\Program Files...

2021-12-24
pgrep
pgrep根据用户给出的信息在当前运行进程中查找并列出符合条件的进程ID(PID) 补充说明pgrep命令 以名称为依据从运行进程队列中查找进程,并显示查找到的进程id。每一个进程ID以一个十进制数表示,通过一个分割字符串和下一个ID分开,默认的分割字符串是一个新行。对于每个属性选项,用户可以在命令行上指定一个以逗号分割的可能值的集合。 语法1pgrep(选项)(参数) 选项1234567-o:仅显示找到的最小(起始)进程号;-n:仅显示找到的最大(结束)进程号;-l:显示进程名称;-P:指定父进程号;-g:指定进程组;-t:指定开启进程的终端;-u:指定进程的有效用户ID。 参数进程名称:指定要查找的进程名称,同时也支持类似grep指令中的匹配模式。 实例1234567891011121314151617181920212223pgrep -lo httpd4557 httpd [root@localhost ~]# pgrep -ln httpd4566 httpd[root@localhost ~]# pgrep -l httpd4557 httpd4560 httpd...

2021-12-24
vdfuse
vdfuseVirtualBox软件挂载VDI分区文件工具 补充说明vdfuse命令 是VirtualBox软件挂载VDI分区文件的一个工具,VirtualBox是一款能创建虚拟机的开源软件,vdi是它的默认磁盘格式。 什么是VirtualBoxVirtualBox是一款功能强大的x86虚拟机软件,它不仅具有丰富的特色,而且性能也很优异。更可喜的是,VirtualBox于数日前走向开源,成为了一个发布在GPL许可之下的自由软件。VirtualBox可以在Linux和Windows主机中运行,并支持在其中安装Windows (NT 4.0、2000、XP、Server 2003、Vista)、DOS/Windows 3.x、Linux (2.4 和 2.6)、OpenBSD等系列的客户操作系统。 在Ubuntu中安装vdfuse,打开终端,输入: 1sudo apt-get install virtualbox-fuse 语法1vdfuse [options] -f image-file mountpoint 选项123456789-h 帮助-r 只读-t 类型 ...

2021-12-24
route
route显示并设置Linux中静态路由表 补充说明route命令 用来显示并设置Linux内核中的网络路由表,route命令设置的路由主要是静态路由。要实现两个不同的子网之间的通信,需要一台连接两个网络的路由器,或者同时位于两个网络的网关来实现。 在Linux系统中设置路由通常是为了解决以下问题:该Linux系统在一个局域网中,局域网中有一个网关,能够让机器访问Internet,那么就需要将这台机器的ip地址设置为Linux机器的默认路由。要注意的是,直接在命令行下执行route命令来添加路由,不会永久保存,当网卡重启或者机器重启之后,该路由就失效了;可以在/etc/rc.local中添加route命令来保证该路由设置永久有效。 语法1route(选项)(参数) 选项1234567-A:设置地址类型;-C:打印将Linux核心的路由缓存;-v:详细信息模式;-n:不执行DNS反向查找,直接显示数字形式的IP地址;-e:netstat格式显示路由表;-net:到一个网络的路由表;-host:到一个主机的路由表。 参数1234567Add:增加指定的路由记录;Del:删除指定的...

2021-12-24
firewall-cmd
firewall-cmdLinux上新用的防火墙软件,跟iptables差不多的工具 补充说明firewall-cmd 是 firewalld的字符界面管理工具,firewalld是centos7的一大特性,最大的好处有两个:支持动态更新,不用重启服务;第二个就是加入了防火墙的“zone”概念。 firewalld跟iptables比起来至少有两大好处: firewalld可以动态修改单条规则,而不需要像iptables那样,在修改了规则后必须得全部刷新才可以生效。 firewalld在使用上要比iptables人性化很多,即使不明白“五张表五条链”而且对TCP/IP协议也不理解也可以实现大部分功能。 firewalld自身并不具备防火墙的功能,而是和iptables一样需要通过内核的netfilter来实现,也就是说firewalld和 iptables一样,他们的作用都是用于维护规则,而真正使用规则干活的是内核的netfilter,只不过firewalld和iptables的结 构以及使用方法不一样罢了。 命令格式 1firewall-cmd [选项 ... ...


