
findobj_demo
Findobj演示
递归查找符合某些条件的所有对象

1 | import numpy as np |
下载这个示例
本博客所有文章除特别声明外,均采用 CC BY-NC-SA 4.0 许可协议。转载请注明来源 Estom的博客!
相关推荐

2021-07-23
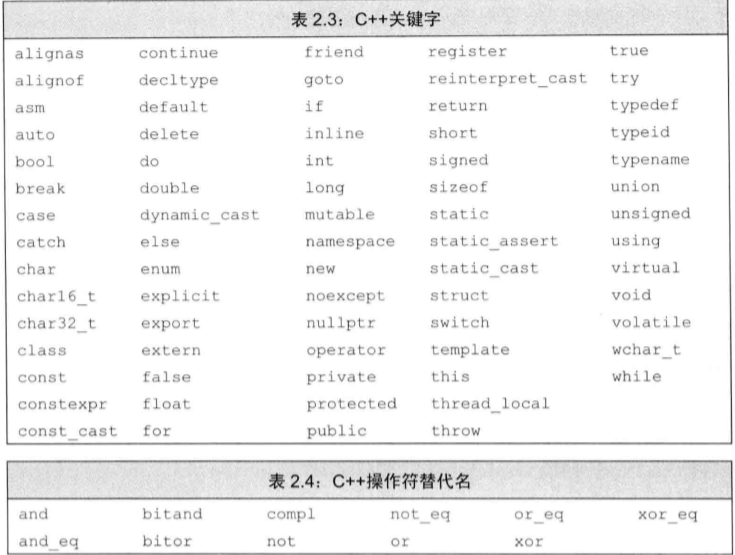
2 C++移动语义
C++移动语义 参考文献 https://www.cnblogs.com/sunchaothu/p/11392116.html https://stackoverflow.com/questions/3106110/what-are-move-semantics/3109981#3109981 1 可拷贝和可移动的概念 在面向对象中,有的类是可以拷贝的,例如车、房等他们的属性是可以复制的,可以调用拷贝构造函数和拷贝赋值函数。 有点类的对象则是独一无二的,或者类的资源是独一无二的,比如 IO 、 std::unique_ptr等,他们不可以复制,但是可以把资源交出所有权给新的对象,称为可以移动的,可以调用移动构造函数和移动赋值函数。 C++11最重要的一个改进之一就是引入了move语义,这样在一些对象的构造时可以获取到已有的资源(如内存)而不需要通过拷贝,申请新的内存,这样移动而非拷贝将会大幅度提升性能。例如有些右值即将消亡析构,这个时候我们用移动构造函数可以接管他们的资源。 2 移动构造函数和移动赋值函数1234567891011121314151617181920212...
2021-04-14
1 数据类型
类型 类是一种类型,是对象的模板,而不是变量或对象。它内部本身不包含对象。只是声明了这种对象的存在。只有创建对象的时候,才会真正的创建对象内部的对象。 1 类型 简单类型 整型 int、short、long、longlong、bool、char、size_t 浮点型 float、double、long double 复合类型 引用&a 指针*pointer 数组 a[] 字符串"hello world" 自定义类型 类class 结构体struct 枚举enum 联合体union 关于size_t的说明:size_t是标准C库中定义的,在64位系统中为long long unsigned int,非64位系统中为long unsigned int。使用size_t可能会提高代码的可移植性、有效性或者可读性,或许同时提高这三者。因为其是基于平台变化的最大支持的无符号整型。 2 字面值常量 常量主要包括字面值常量和自定义常量。 整型字面常量 不同进制指的是字面格式,其转化为存储格式时,都会变成二进制存储。不必担心十进制与二进制之间的运...
2021-03-05
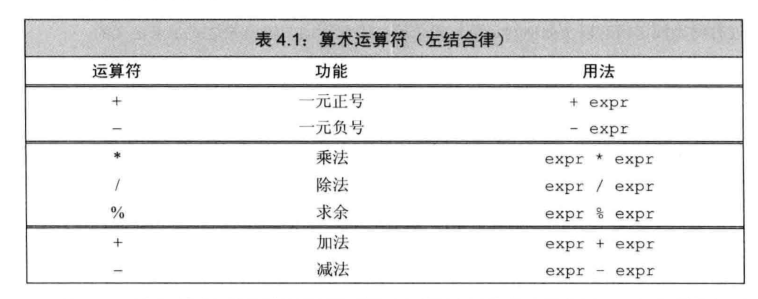
3 表达式
表达式1 基础组合运算 优先级 结合律 类型转换运算符重载左值和右值2 算数运算符 3 逻辑和关系运算法 短路求值 逻辑与,当第一个判定为否的时候,不再执行第二个判定,可以用来屏蔽第二步的计算,代替条件判断!!!!!!! 逻辑或,当第一个判定为是的时候,不再执行第二个判定,可以用来屏蔽第二步的计算,代替条件判断!!!!!!! 当且晋档左侧的运算对象无法确定表达式的结果是,才会计算右侧运算对象的值! 4 赋值运算法 5 递增递减运算符 尽量使用前置版本的自增自减运算符。 后置递增运算符的优先级高于解引用的运算符。 1*pb++ //等价于*(pb++) 6 成员访问运算符 点运算符。对象成员访问运算符。 箭头运算符。指针成员访问运算符。 解引用运算符的优先级抵御点运算符。所以解引用运算符的优先级很低。 1*p.size();//相互等价*(p.size()) 7 条件运算符 ?: 8 位运算符 位运算符作用域证书类型的运算对象,并把运算对象看成二进制位的集合。 9 sizeof 运算符10 逗号运算符11 类型转换隐式类型转换——算数转换 整形提升 其他隐式类型...
2021-04-08
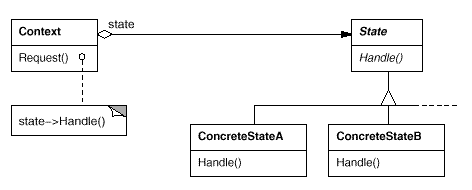
4.8 状态
意图 允许一个对象在其内部状态改变时改变它的行为。对象看起来似乎修改了它的类。 结构 参与者 Context 定义客户感兴趣的接口。 维护一个 ConcreteState 子类的实例,这个实例定义当前状态。 State 定义一个接口以封装与 Context 的一个特定状态相关的额行为。 ConcreteState 每一个子类实现一个与 Context 的一个状态相关的行为。 适用性 在以下情况下可以使用 State 模式: 一个对象的行为取决于它的状态,并且它必须在运行时根据状态改变它的行为。 一个操作中含有庞大的多分支的条件语句,且这些分支依赖于该对象的状态。这个状态通常用一个或多个枚举常量表示。 效果 它将与特定状态相关的行为局部化。 它使得状态转换显式化。 State 对象可被共享。 相关模式 使用 Flyweight 模式共享状态对象。 使用 Singleton 模式实现状态对象。 Implementation糖果销售机有多种状态,每种状态下销售机有不同的行为,状态可以发生转移,使得销售机的行为也发生改变。 123456789...

2022-11-24
mockito
官网http://mockito.org/API http://docs.mockito.googlecode.com/hg/org/mockito/Mockito.html抄笔记,https://www.letianbiji.com/java-mockito/mockito-test-isolate.html 基本概念单元测试UT工作一段时间后,才真正意识到代码质量的重要性。虽然囫囵吞枣式地开发,表面上看来速度很快,但是给后续的维护与拓展制造了很多隐患。作为一个想专业但还不专业的程序员,通过构建覆盖率比较高的单元测试用例,可以比较显著地提高代码质量。如后续需求变更、版本迭代时,重新跑一次单元测试即可校验自己的改动是否正确。 是什么Mockito是mocking框架,它让你用简洁的API做测试。而且Mockito简单易学,它可读性强和验证语法简洁。 Stub和Mock异同相同:Stub和Mock都是模拟外部依赖不同:Stub是完全模拟一个外部依赖, 而Mock还可以用来判断测试通过还是失败 与Junit框架一同使用请MockitoAnnotations.initMocks(...

2022-04-18
18 原型
在 JavaScript 中,函数是一个包含属性和方法的 Function 类型的对象。而原型(Prototype)就是 Function 类型对象的一个属性。 在函数定义时就包含了 prototype 属性,它的初始值是一个空对象。在 JavaScript 中并没有定义函数的原型类型,所以原型可以是任何类型。 原型是用于保存对象的共享属性和方法的,原型的属性和方法并不会影响函数本身的属性和方法。 1234function foo(a,b){ return a + b;}console.log( typeof foo.prototype );// object 获取原型通过如下两种方式可以获取对象的原型,从而设置共享的属性和方法: 通过构造函数的 prototype 属性。 1234function Person() { console.log('Person instantiated');}console.log( Person.prototype ); 通过 Object 对象的 getPrototypeO...


