
histogram_path
使用“矩形”和“多边形”构建直方图
使用路径补丁绘制矩形。 使用大量Rectangle实例的技术或使用PolyCollections的更快方法是在我们在mpl中使用moveto / lineto,closepoly等的正确路径之前实现的。 现在我们拥有它们,我们可以使用PathCollection更有效地绘制具有同质属性的常规形状对象的集合。 这个例子创建了一个直方图 - 在开始时设置顶点数组的工作量更大,但对于大量对象来说它应该更快。
1 | import numpy as np |

应该注意的是,我们可以使用顶点和代码直接创建复合路径,而不是创建三维数组并使用make_compound_path_from_polys,如下所示
1 | nrects = len(left) |
参考
此示例中显示了以下函数,方法,类和模块的使用:
1 | import matplotlib |
下载这个示例
本博客所有文章除特别声明外,均采用 CC BY-NC-SA 4.0 许可协议。转载请注明来源 Estom的博客!
相关推荐

2020-07-21
9 JSON
1 JSON 简介JSON 是存储和传输数据的格式。 JSON 经常在数据从服务器发送到网页时使用。 JSON 指的是 JavaScript Object Notation JSON 是轻量级的数据交换格式 JSON 独立于语言 * JSON 是“自描述的”且易于理解 2 JSON使用基本语法 数据是名称/值对 数据由逗号分隔 花括号保存对象 方括号保存数组 JSONObjectJSON 数据的书写方式是名称/值对。 名称/值对由(双引号中的)字段名构成,其后是冒号,再其后是值:JSON 对象是在花括号内书写的。 1{"firstName":"Bill", "lastName":"Gates"} JSONArrayJSON 数组在方括号中书写。 12345"employees":[ {"firstName":"Bill", "lastName":&q...

2020-09-26
common_date_problems
修复常见的日期困扰Matplotlib允许您原生地绘制python日期时间实例,并且在大多数情况下可以很好地选择刻度位置和字符串格式。 有一些事情没有得到如此优雅的处理,这里有一些技巧可以帮助你解决它们。我们将在numpy记录数组中加载一些包含datetime.date对象的样本日期数据: 12345678910111213In [63]: datafile = cbook.get_sample_data('goog.npz')In [64]: r = np.load(datafile)['price_data'].view(np.recarray)In [65]: r.dtypeOut[65]: dtype([('date', '<M8[D]'), ('', '|V4'), ('open', '<f8'), ('high', '<f8'...

2019-11-30
9 字符串
字符串1 简介在 Scala 中,字符串的类型实际上是 Java String,它本身没有 String 类。 在 Scala 中,String 是一个不可变的对象,所以该对象不可被修改。这就意味着你如果修改字符串就会产生一个新的字符串对象。 但其他对象,如数组就是可变的对象。接下来我们会为大家介绍常用的 java.lang.String 方法。 2 常用方法创建字符串创建字符串实例如下: var greeting = “Hello World!”; 或 var greeting:String = “Hello World!”; 字符串长度我们可以使用 length() 方法来获取字符串长度: object Test { def main(args: Array[String]) { var palindrome = “www.runoob.com“; var len = palindrome.length(); println( “String Length is : “ + len ); }} 字符...

2020-09-26
create_subplots
轻松创建子图在matplotlib的早期版本中,如果你想使用pythonic API并创建一个图形实例,并从中创建一个子图的网格,可能有共享轴,它涉及相当数量的样板代码。例如: 1234567891011import matplotlib.pyplot as pltimport numpy as npx = np.random.randn(50)# old stylefig = plt.figure()ax1 = fig.add_subplot(221)ax2 = fig.add_subplot(222, sharex=ax1, sharey=ax1)ax3 = fig.add_subplot(223, sharex=ax1, sharey=ax1)ax3 = fig.add_subplot(224, sharex=ax1, sharey=ax1) 费尔南多·佩雷斯提供了一个很好的方法来创建子图的一切 subplots()(最后注意“s”),并为整个群体打开x和y共享。您可以单独打开轴… 123# new style method 1; unpack the axesfig,...

2021-07-23
2 C++移动语义
C++移动语义 参考文献 https://www.cnblogs.com/sunchaothu/p/11392116.html https://stackoverflow.com/questions/3106110/what-are-move-semantics/3109981#3109981 1 可拷贝和可移动的概念 在面向对象中,有的类是可以拷贝的,例如车、房等他们的属性是可以复制的,可以调用拷贝构造函数和拷贝赋值函数。 有点类的对象则是独一无二的,或者类的资源是独一无二的,比如 IO 、 std::unique_ptr等,他们不可以复制,但是可以把资源交出所有权给新的对象,称为可以移动的,可以调用移动构造函数和移动赋值函数。 C++11最重要的一个改进之一就是引入了move语义,这样在一些对象的构造时可以获取到已有的资源(如内存)而不需要通过拷贝,申请新的内存,这样移动而非拷贝将会大幅度提升性能。例如有些右值即将消亡析构,这个时候我们用移动构造函数可以接管他们的资源。 2 移动构造函数和移动赋值函数1234567891011121314151617181920212...
2025-09-03
02 Java内存区域与内存溢出
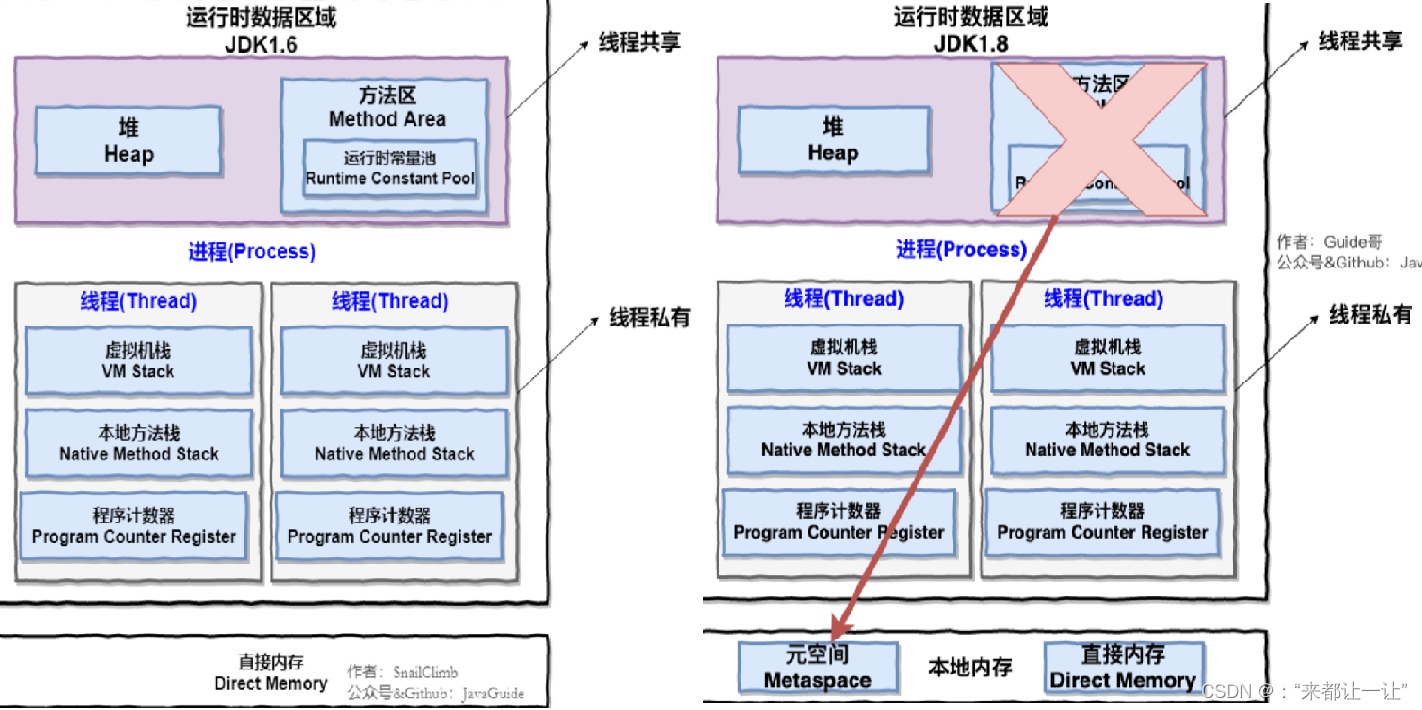
2 Java内存区域与内存溢出异常2.1 概述虚拟机提供的最大的能力:自动内存管理。不再需要用户为每一个操作去写配对的delete、free代码,不需要手动管理内存的申请和释放,不容易出现内存泄漏的问题。这也符合并奠定了Java的操作哲学,通过各种各样的运行时接管一些常规的传统语言的操作。 2.2 运行时内存区域 程序计数器:当前线程所执行的字节码的行号指示器。多线程通过线程切换、分配处理器执行,每条线程都需要一个独立的程序计数器,各线程之间计数器互不影响、独立存储,是线程私有的内存。 Java虚拟机栈:Java方法执行的内存模型。每个方法执行的时候,创建一个栈帧用于存储局部变量表、操作数栈、动态链接、方法出口等信息。线程私有的内存。局部变量表存放了编译器可知的各种Java虚拟机基本变量类型、对象引用、返回地址类型,局部变量表所需要的空间是在编译期间分配完成的,运行过程中,当进入一个方法时,这个方法需要再栈帧中分配多大的局部变量空间是完全确定的。 本地方法栈:本地方法的栈帧。也是线程私有的内存。 堆:用于存放对象实例。被所有线程共享的一块内存区域,是垃圾收集器管理的内存区域。可...


