
plotfile_demo
Plotfile演示
使用plotfile直接从文件绘制数据的示例。
1 | import matplotlib.pyplot as plt |
下载这个示例
本博客所有文章除特别声明外,均采用 CC BY-NC-SA 4.0 许可协议。转载请注明来源 Estom的博客!
相关推荐
2021-04-08
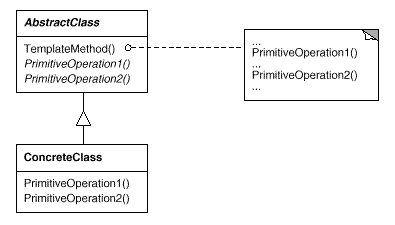
4.10 模板方法
意图 定义一个操作中的算法的骨架,而将一些步骤延迟到子类中。 Template Method 使得子类可以不改变一个算法的结构即可重定义该算法的某些特定步骤。 结构 参与者 AbstractClass 定义抽象的原语操作(PrimitiveOperation),具体的子类将重定义它们以实现一个算法的各步骤。 实现一个模板方法,定义一个算法的骨架。该模板方法不仅调用原语操作,也调用定义在类中的其他操作。 ConcreteClass 实现原语操作以完成算法中与特定子类相关的步骤。 适用性 在以下情况下可以使用 Template Method 模式: 一次性实现一个算法的不变的部分,并将可变的行为留给子类来实现。 各子类中公共的行为应被提取出来并集中到一个公共父类中以避免代码重复。 控制子类扩展。只允许特定的点进行扩展。 效果 模板方法是一种代码复用的基本技术。 “好莱坞法则:Don’t call us, we’ll callyou.”,一个父类调用一个子类的操作,而不是相反。 相关模式 Factory Method 常被 Template Method...

2020-09-26
categorical_variables
绘制分类变量如何在Matplotlib中使用分类变量。 很多时候你想创建一个在Matplotlib中使用分类变量的图。Matplotlib允许你将分类变量直接传递给许多绘图函数,我们将在下面演示。 1234567891011import matplotlib.pyplot as pltdata = {'apples': 10, 'oranges': 15, 'lemons': 5, 'limes': 20}names = list(data.keys())values = list(data.values())fig, axs = plt.subplots(1, 3, figsize=(9, 3), sharey=True)axs[0].bar(names, values)axs[1].scatter(names, values)axs[2].plot(names, values)fig.suptitle('Categorical Plotting') ; 这...
2023-11-26
05 连接池
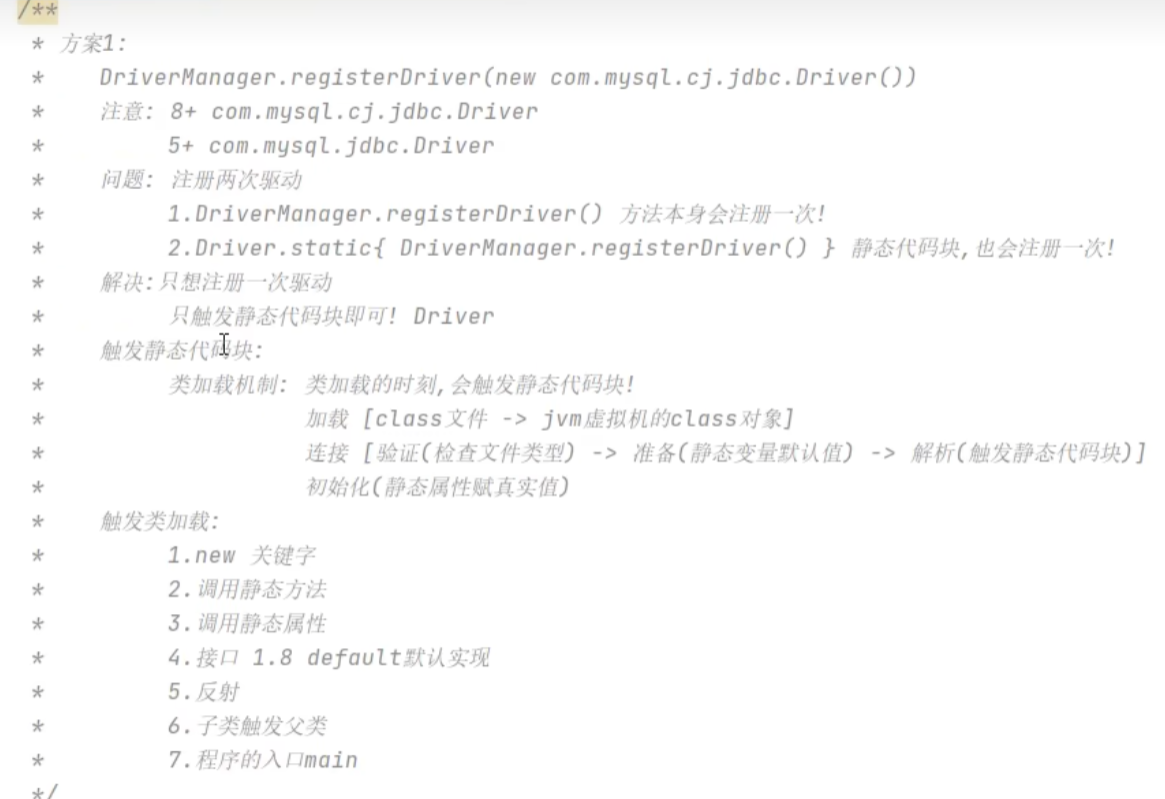
1 简介JDBC数据库连接池的必要性在使用开发基于数据库的 web 程序时,传统的模式基本是按以下步骤: 在主程序(如 servlet、beans )中建立数据库连接 进行 sql 操作 断开数据库连接 这种模式开发,存在的问题: 普通的 JDBC 数据库连接使用 DriverManager 来获取,每次向数据库建立连接的时候都要将 Connection 加载到内存中,再验证用户名和密码(得花费0.05s~1s的时间)。需要数据库连接的时候,就向数据库要求一个,执行完成后再断开连接。这样的方式将会消耗大量的资源和时间。数据库的连接资源并没有得到很好的重复利用。 若同时有几百人甚至几千人在线,频繁的进行数据库连接操作将占用很多的系统资源,严重的甚至会造成服务器的崩溃。 对于每一次数据库连接,使用完后都得断开。 否则,如果程序出现异常而未能关闭,将会导致数据库系统中的内存泄漏,最终将导致重启数据库。(回忆:何为 Java 的内存泄漏?)这种开发不能控制被创建的连接对象数,系统资源会被毫无顾及的分配出去,如连接过多,也可能导致内存泄漏,服务器崩溃。 数据库连接池技术为解决传统开发中...

2021-09-07
1.0-chinese
第1章 你好,C++的并发世界!本章主要内容 何谓并发和多线程 应用程序为什么要使用并发和多线程 C++的并发史 一个简单的C++多线程程序 令C++用户振奋的时刻到了。距初始的C++标准(1998年)发布13年后,C++标准委员会给语言本身,以及标准库,带来了一次重大的变革。 新C++标准(也被称为C++11或C++0x)在2011年发布,带来一系列的变革让C++编程更加简单和高效。 其中一个最重要的新特性就是对多线程的支持。 C++标准第一次承认多线程在语言中的存在,并在标准库中为多线程提供组件。这意味着使用C++编写与平台无关的多线程程序成为可能,也为可移植性提供了强有力的保证。与此同时,程序员们为提高应用的性能,对并发的关注也是与日俱增,特别在多线程编程方面。 本书是介绍如何使用C++11多线程来编写并发程序,及相关的语言特性和库工具(library facilities)。本书以“解释并发和多线程的含义,为什么要使用并发”作为起始点,在对“什么情况下不使用并发”进行阐述之后,将对C++支持的并发方式进行概述;最后,以一个简单的C++并发实例结束这一章。资深的多线程开...

2020-09-26
annotation_polar
注释极坐标此示例显示如何在极坐标图上创建注释。 有关注释功能的完整概述,另请参阅注释教程。 123456789101112131415161718192021import numpy as npimport matplotlib.pyplot as pltfig = plt.figure()ax = fig.add_subplot(111, polar=True)r = np.arange(0,1,0.001)theta = 2 * 2*np.pi * rline, = ax.plot(theta, r, color='#ee8d18', lw=3)ind = 800thisr, thistheta = r[ind], theta[ind]ax.plot([thistheta], [thisr], 'o')ax.annotate('a polar annotation', xy=(thistheta, thisr), # theta, radius xytext=(0.05,...

2021-03-20
32
3.3. 模型评估: 量化预测的质量校验者: @飓风 @小瑶 @FAME @v @Loopy翻译者: @小瑶 @片刻 @那伊抹微笑 有 3 种不同的 API 用于评估模型预测的质量: Estimator score method(估计器得分的方法): Estimators(估计器)有一个 score(得分) 方法,为其解决的问题提供了默认的 evaluation criterion (评估标准)。 在这个页面上没有相关讨论,但是在每个 estimator (估计器)的文档中会有相关的讨论。 Scoring parameter(评分参数): Model-evaluation tools (模型评估工具)使用 cross-validation (如 model_selection.cross_val_score 和 model_selection.GridSearchCV) 依靠 internal scoring strategy (内部 scoring(得分) 策略)。...


