
zorder_demo
Zorder演示
轴的默认绘制顺序是补丁,线条,文本。 此顺序由zorder属性确定。 设置以下默认值
| Artist | Z-order |
|---|---|
| Patch / PatchCollection | 1 |
| Line2D / LineCollection | 2 |
| Text | 3 |
您可以通过设置zorder来更改单个艺术家的顺序。任何单独的plot() 调用都可以为该特定项的zorder设置一个值。
在下面的第一个子图中,线条在散点图上方的补丁集合上方绘制,这是默认值。
在下面的子图中,顺序颠倒过来。
第二个图显示了如何控制各行的zorder。
1 | import matplotlib.pyplot as plt |
分散的顶部的线
1 | plt.figure() |

一个新的图像,带有单独订购的物品
1 | x = np.linspace(0, 2*np.pi, 100) |

下载这个示例
本博客所有文章除特别声明外,均采用 CC BY-NC-SA 4.0 许可协议。转载请注明来源 Estom的博客!
相关推荐

2021-12-24
history
history显示或操作历史列表。 概要123history [-c] [-d offset] [n]history -anrw [filename]history -ps arg [arg...] 主要用途 显示历史列表。 操作历史列表。 选项12345678-c 清空历史列表。-d offset 根据offset删除记录。如果是正数则表示offset位置的记录,如果为负数则表示从结尾向前offset位置的记录。-a 将当前终端的历史记录行添加到历史记录文件。-n 将尚未从历史文件中读取的历史行追加到当前历史列表中。-r 读取历史文件,并将其内容附加到历史列表中。-w 将当前历史记录列表附加到历史记录文件中并且附加它们到历史列表中。-p 在每个arg上执行历史记录扩展并在标准输出上显示结果,而不将结果存储在历史记录列表中。-s 将每个arg作为单个条目附加到历史记录列表。 参数n:可选,只列出最近的n条记录。 filenam...
2022-12-19
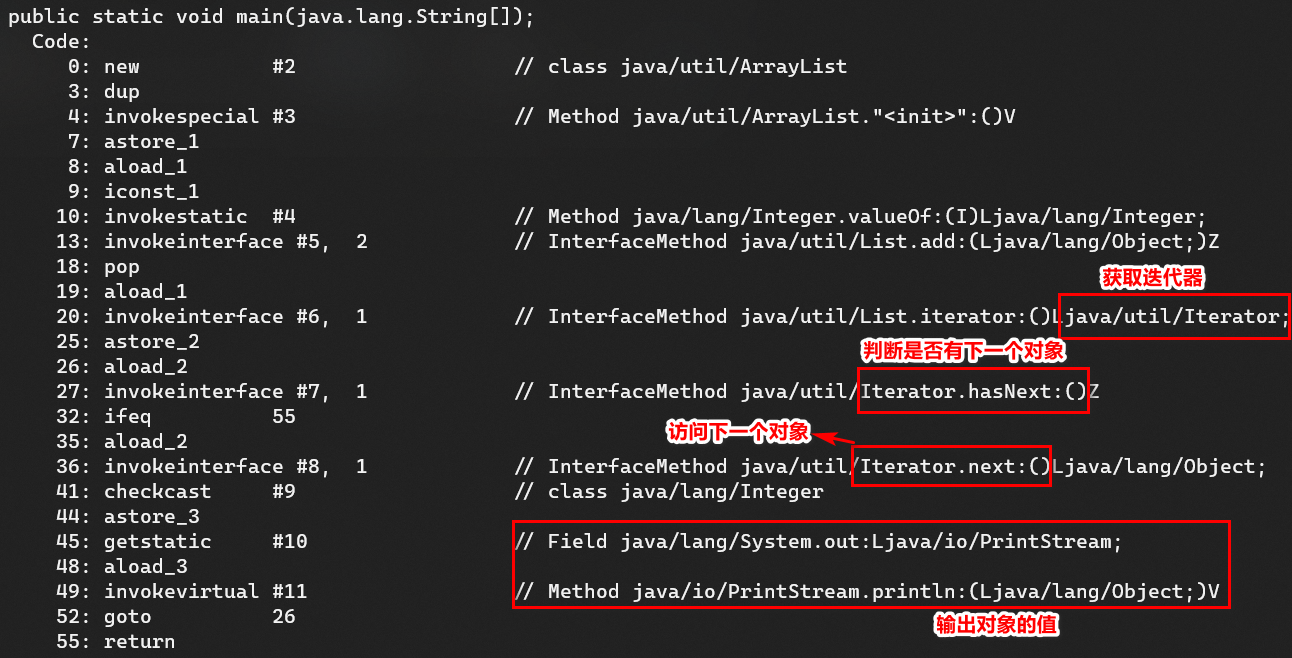
07 Iterable&Ieterator
Iterator Iterable ListIterator1 Iterator所有Java集合类都提供iterator()方法,该方法返回Iterator的实例以遍历该集合中的元素。 12345public interface Iterator<E> { boolean hasNext(); E next(); void remove();} 提供的API接口含义如下: hasNext():判断集合中是否存在下一个对象 next():返回集合中的下一个对象,并将访问指针移动一位 remove():删除集合中调用next()方法返回的对象.每次调用next()只能调用一次此方法。 在早期,遍历集合的方式只有一种,通过Iterator迭代器操作 12345678910List<Integer> list = new ArrayList<>();list.add(1);list.add(2);list.add(3);Iterator iter = list.iterator();while (iter....

2021-09-02
05-自定义错误处理
概述开始今天的文章,为什么要自定义错误处理?默认的错误处理方式是什么? 那好,咱们就先说下默认的错误处理。 默认的错误处理是 errors.New("错误信息"),这个信息通过 error 类型的返回值进行返回。 举个简单的例子: 12345678func hello(name string) (str string, err error) { if name == "" { err = errors.New("name 不能为空") return } str = fmt.Sprintf("hello: %s", name) return} 当调用这个方法时: 123456var name = ""str, err := hello(name)if err != nil { fmt.Println(err.Error()) return} 这就是默认的错误处理,下面还会用这个例子进行说。 这个默认的错误处理,只是...

2021-09-07
filesystem
Filesystem简单的文件读写是通过uv_fs_*函数族和与之相关的uv_fs_t结构体完成的。 note libuv 提供的文件操作和 socket operations 并不相同。套接字操作使用了操作系统本身提供了非阻塞操作,而文件操作内部使用了阻塞函数,但是 libuv 是在线程池中调用这些函数,并在应用程序需要交互时通知在事件循环中注册的监视器。 所有的文件操作函数都有两种形式 - 同步**(synchronous)** 和 异步**( asynchronous)**。 同步方式如果没有指定回调函数则会被自动调用( 并阻塞),函数的返回值是libuv error code 。但以上通常只对同步调用有意义。而异步方式则会在传入回调函数时被调用, 并且返回 0。 Reading/Writing files文件描述符可以采用如下方式获得: 1int uv_fs_open(uv_loop_t* loop, uv_fs_t* req, const char* path, int flags, int mode, uv_fs_cb cb) 参数flags与mode...

2020-09-26
animation_demo
pyplot动画通过调用绘图命令之间的暂停来生成动画。 此处显示的方法仅适用于简单,低性能的使用。 对于要求更高的应用程序,请查看动画模块和使用它的示例。 请注意,调用time.sleep而不是暂停将不起作用。 1234567891011121314import matplotlib.pyplot as pltimport numpy as npnp.random.seed(19680801)data = np.random.random((50, 50, 50))fig, ax = plt.subplots()for i in range(len(data)): ax.cla() ax.imshow(data[i]) ax.set_title("frame {}".format(i)) # Note that using time.sleep does *not* work here! plt.pause(0.1) 脚本总运行时间:(0分7.211秒) 下载这个示例 下载python源码: animati...

2020-09-26
transoffset
Transoffset这说明了使用transforms.offset_copy进行变换,该变换将绘图元素(如文本字符串)定位在屏幕坐标(点或英寸)中相对于任何坐标中给出的位置的指定偏移处。 每个Artist - 从中派生Text和Line等类的mpl类 - 都有一个可以在创建Artist时设置的转换,例如通过相应的pyplot命令。 默认情况下,这通常是Axes.transData转换,从数据单元到屏幕点。 我们可以使用offset_copy函数来修改此转换的副本,其中修改包含偏移量。 12345678910111213141516171819202122232425262728293031323334353637import matplotlib.pyplot as pltimport matplotlib.transforms as mtransformsimport numpy as npxs = np.arange(7)ys = xs**2fig = plt.figure(figsize=(5, 10))ax = plt.subplot(2, 1, 1)# If we...


