
3d_bars
3D条形图演示
有关如何使用和不使用着色绘制3D条形图的基本演示。

1 | import numpy as np |
下载这个示例
本博客所有文章除特别声明外,均采用 CC BY-NC-SA 4.0 许可协议。转载请注明来源 Estom的博客!
相关推荐

2021-12-24
nc
nc用于设置路由器,是网络工具中的瑞士军刀。 补充说明nc命令 全称netcat,用于设置路由器。它能通过 TCP 和 UDP 在网络中读写数据。通过与其他工具结合和重定向,你可以在脚本中以多种方式使用它。使用 netcat 命令所能完成的事情令人惊讶。 语法12nc [-hlnruz][-g<网关...>][-G<指向器数目>][-i<延迟秒数>][-o<输出文件>][-p<通信端口>][-s<来源位址>][-v...][-w<超时秒数>][主机名称][通信端口...] 选项1234567891011121314-g <网关> # 设置路由器跃程通信网关,最多可设置8个。-G<指向器数目> # 设置来源路由指向器,其数值为4的倍数。-h 在线帮助。-i<延迟秒数> 设置时间间隔,以便传送信息及扫描通信端口。-l 使用监听模式,管控传入的资料。-n 直接使用IP地址,而不通过域名服务器。-o<输出文件> # 指定文件名称,把往来传输的数据以16进制...

2021-12-24
times
times显示进程累计时间。 主要用途 打印出shell及其子进程累计使用的用户时间和系统时间。 返回值总是返回成功。 例子12345678# 执行命令times# 返回结果0m0.037s 0m0.009s0m0.010s 0m0.024s# 根据times(2)的man手册,对应关系如下:# 用户时间 | 系统时间# 子进程的用户时间 | 子进程的系统时间 注意 该命令是bash内建命令,相关的帮助信息请查看help命令。

2021-04-08
github
1 使用github 参考文献[https://www.bilibili.com/video/av10475153/index_2.html\#page=5] github的简介 Create Repository创建仓库 Star收藏 Fork复制一份远程仓库 Pull Request拉我呀,快点,我改好了。 Open & Merge Request拉你了,别墨迹。 Watch看着你呢,关注一个项目。 Github主页仓库主页——仓库相关的信息和相关操作 2 pull request3 fork syncize 参考文献 https://blog.csdn.net/qq_22918243/article/details/89642445 配置fork远程仓库 查看fork之后的项目的远程仓库状态 1git remote -v 添加一个将被同步给 fork 远程的上游仓库 1git remote add upstream <git_url> 再次查看状态确认是否配置成功 同步Fork 从上游仓库 fetch 分...

2022-12-04
12.redis应用示例
- [1. 统计活跃用户](#1-统计活跃用户) - [2. 搭建高可用redis集群](#2-搭建高可用redis集群) - [1. 常见redis集群](#1-常见redis集群) - [2. 单机版redis集群](#2-单机版redis集群) - [2.1 修改redis配置文件](#21-修改redis配置文件) - [2.2 重新打包redis镜像](#22-重新打包redis镜像) - [2.3 编辑docker-compose.yml文件](#23-编辑docker-composeyml文件) - [2.4 创建redis集群](#24-创建redis集群) - [2.5 创建带有密码的redis集群](#25-创建带有密码的redis集群) - [2.6 创建集群中遇到的问题](#26-创建集群中遇到的问题) # 1. 统计活跃用户 场景: 1亿个用户,用户登陆,标记为今天活跃,否则记为不活跃,记录最活跃用户。 12345678910111213141516171819202122232425262...

2020-09-23
3控制流
if语句12345678910111213>>> x = int(input("Please enter an integer: "))Please enter an integer: 42>>> if x < 0:... x = 0... print('Negative changed to zero')... elif x == 0:... print('Zero')... elif x == 1:... print('Single')... else:... print('More')...More for语句对任意序列进行迭代(例如列表或字符串),条目的迭代顺序与它们在序列中出现的顺序一致。 12345678>>> # Measure some strings:... words = ['cat', 'window', '...
2021-04-24
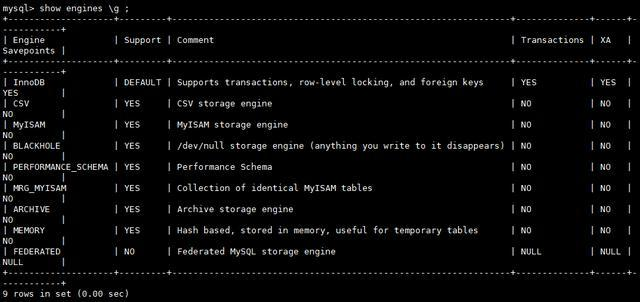
附录1 MySQL存储引擎
MySQL存储引擎1 概述MySQL架构存储引擎 MySQL中的数据用各种不同的技术存储在文件(或者内存)中。这些技术中的每一种技术都使用不同的存储机制、索引技巧、锁定水平并且最终提供广泛的不同的功能和能力。通过选择不同的技术,你能够获得额外的速度或者功能,从而改善你的应用的整体功能。 例如,如果你在研究大量的临时数据,你也许需要使用内存MySQL存储引擎。内存存储引擎能够在内存中存储所有的表格数据。又或者,你也许需要一个支持事务处理的数据库(以确保事务处理不成功时数据的回退能力)。 这些不同的技术以及配套的相关功能在 MySQL中被称作存储引擎(也称作表类型)。 MySQL默认配置了许多不同的存储引擎,可以预先设置或者在MySQL服务器中启用。你可以选择适用于服务器、数据库和表格的存储引擎,以便在选择如何存储你的信息、如何检索这些信息以及你需要你的数据结合什么性能和功能的时候为你提供最大的灵活性。 MySQL支持的存储引擎 存储引擎对比 功 能 MYISAM Memory InnoDB Archive 存储限制 256TB RAM 64TB None 支...


