
voxels_torus
具有圆柱坐标的3D体素/体积图
演示使用ax.voxels的x,y,z参数。

1 | import matplotlib.pyplot as plt |
下载这个示例
本博客所有文章除特别声明外,均采用 CC BY-NC-SA 4.0 许可协议。转载请注明来源 Estom的博客!
相关推荐

2020-10-13
2_Regression Case Study
Regression:Case Study回归问题 预测 给出特征,预测特征的结果 推荐 一般包括两组对象。描述两组对象之间的关联性。 例如读者+文章的推荐系统。读者的特征敏感度$\theta$+文章特征$x_i$。基于个人浏览记录和文章特征的内容推荐系统,给定后者,训练读者的特征敏感度,然后推荐;基于文章被浏览的记录和读者特征的内容推荐系统,给定前者,训练文章本身的特征,然后推荐;基于协同过滤算法,前者后者都没有,进行推荐。 机器学习的约定 使用上标代表数据集中单条数据的定位。 使用下表代表单条数据中组成元素的定位。 假设函数,即训练模型。 损失函数,是关于参数的函数。 如何实现一个机器学习算法 定义模型,给出假设函数,关于输入输出的函数。 定义损失,给出代价函数,关于参数的函数,输入输出用数据集代替。 梯度下降,最小化代价函数。 问题的导入:预测宝可梦的CP值Estimating the Combat Power(CP) of a pokemon after evolution 我们期望根据已有的宝可梦进化前后的信息,来预测某只宝可梦进化后的cp值的大小 确定...

2020-09-26
histogram_multihist
使用多个数据集演示直方图(hist)函数绘制具有多个样本集的直方图并演示: 使用带有多个样本集的图例 堆积图 没有填充的步进曲线 不同样本量的数据集 选择不同的存储量和大小会显著影响直方图的形状。Astropy文档有很多关于如何选择这些参数的部分: http://docs.astropy.org/en/stable/visualization/histogram.html 1234567891011121314151617181920212223242526272829import numpy as npimport matplotlib.pyplot as pltnp.random.seed(19680801)n_bins = 10x = np.random.randn(1000, 3)fig, axes = plt.subplots(nrows=2, ncols=2)ax0, ax1, ax2, ax3 = axes.flatten()colors = ['red', 'tan', 'lime']ax0.his...
2021-03-20
20
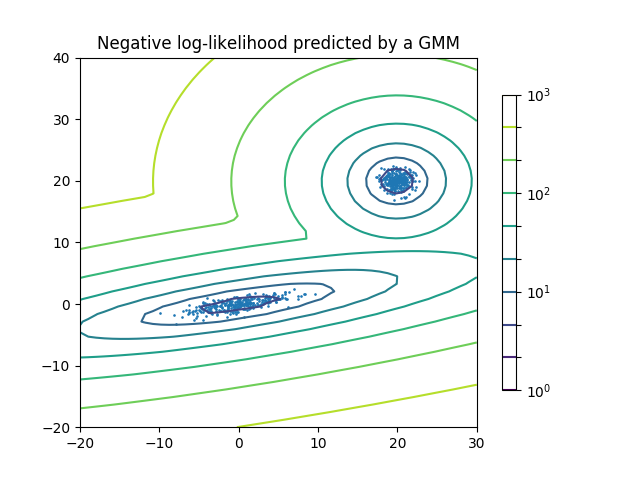
2.1. 高斯混合模型校验者: @why2lyj @Shao Y. @Loopy @barrycg翻译者: @glassy sklearn.mixture 是一个应用高斯混合模型进行非监督学习的包(支持 diagonal,spherical,tied,full 四种协方差矩阵), (注:diagonal 指每个分量有各自独立的对角协方差矩阵, spherical 指每个分量有各自独立的方差(再注:spherical是一种特殊的 diagonal, 对角的元素相等), tied 指所有分量共享一个标准协方差矩阵, full 指每个分量有各自独立的标准协方差矩阵),它可以对数据进行抽样,并且根据数据来估计模型。同时该包也支持由用户来决定模型内混合的分量数量。 (译注:在高斯混合模型中,我们将每一个高斯分布称为一个分量,即 component) 二分量高斯混合模型: 数据点,以及模型的等概率线。 高斯混合模型是一个假设所有的数据点都是生成于有限个带有未知参数的高斯分布所混合的概率模型。 我们可以将这种混合模型看作...

2021-12-24
xargs
xargs给其他命令传递参数的一个过滤器 补充说明xargs 命令 是给其他命令传递参数的一个过滤器,也是组合多个命令的一个工具。它擅长将标准输入数据转换成命令行参数,xargs 能够处理管道或者 stdin 并将其转换成特定命令的命令参数。xargs 也可以将单行或多行文本输入转换为其他格式,例如多行变单行,单行变多行。xargs 的默认命令是 echo,空格是默认定界符。这意味着通过管道传递给 xargs 的输入将会包含换行和空白,不过通过 xargs 的处理,换行和空白将被空格取代。xargs 是构建单行命令的重要组件之一。 将输入分割成多个,分别执行后续的命令。例如这里每一行都是一个文件名,相当于多个文件或者多个文本,分别执行后续的处理。 如果只用|管道运算符,表示将之前的命令作为一整个命令进行执行。例如返回的整体作为一个文本进行处理 xargs 命令用法xargs 用作替换工具,读取输入数据重新格式化后输出。 定义一个测试文件,内有多行文本数据: 1234567cat test.txta b c d e f gh i j k l m no p qr s tu v w...

2020-09-26
pie_and_donut_labels
标记饼图和空心饼图欢迎来到Matplotlib面包店。我们将通过 pie 方法 (pie method) 创建一个饼图和一个空心饼图表,并展示如何使用图例和注释来标记它们。 与往常一样,我们将从定义导入开始,并创建一个带有子图的图形。现在是吃派的时候了。从饼图开始,我们从数据和标签列表中创建数据。 我们可以为autopct参数提供一个函数,它将通过显示绝对值来扩展自动百分比标记;我们从相对数据和已知的所有值之和计算出后者。 然后,我们创建饼图并存储返回的对象以供日后使用。返回元组的第一个返回元素是楔形列表。这些是matplotlib.patches.WEdge 补丁,可以直接用作图例的句柄。我们可以使用图例的bbox_to_anchor参数将图例放在饼图之外。这里我们使用轴坐标(1,0,0.5,1)和“中间左”的位置;即图例的左中心点位于边界框的左中心点,在轴坐标中从(1,0)到(1.5,1)。 然后我们创建馅饼并存储返回的对象,以备以后使用。返回的元组的第一个返回元素是楔体列表。这些是matplotlib.patches.WEdge 面片,可以直接用作图例的句柄。我们可以使用图...

2020-09-23
2.4字典
Python 字典 原文: https://thepythonguru.com/python-dictionaries/ 于 2020 年 1 月 7 日更新 字典是一种 python 数据类型,用于存储键值对。 它使您可以使用键快速检索,添加,删除,修改值。 字典与我们在其他语言上称为关联数组或哈希的非常相似。 注意: 字典是可变的。 创建字典 可以使用一对大括号({})创建字典。 字典中的每个项目都由一个键,一个冒号,一个值组成。 每个项目都用逗号(,)分隔。 让我们举个例子。 12345friends = {'tom' : '111-222-333','jerry' : '666-33-111'} 这里friends是有两个项目的字典。 需要注意的一点是,键必须是可哈希的类型,但是值可以是任何类型。 字典中的每个键都必须是唯一的。 12>>> dict_emp = {} # this will create an empty di...


