
polar_demo
极轴上绘制线段
在极轴上绘制线图的演示。
1 | import numpy as np |

参考
本示例中显示了以下函数,方法,类和模块的使用:
1 | import matplotlib |
下载这个示例
本博客所有文章除特别声明外,均采用 CC BY-NC-SA 4.0 许可协议。转载请注明来源 Estom的博客!
相关推荐
2021-03-20
3
三、分类 译者:@时间魔术师 校对者:@Lisanaaa、@飞龙、@ZTFrom1994、@XinQiu、@tabeworks、@JasonLee、@howie.hu 在第一章我们提到过最常用的监督学习任务是回归(用于预测某个值)和分类(预测某个类别)。在第二章我们探索了一个回归任务:预测房价。我们使用了多种算法,诸如线性回归,决策树,和随机森林(这个将会在后面的章节更详细地讨论)。现在我们将我们的注意力转到分类任务上。 MNIST在本章当中,我们将会使用 MNIST 这个数据集,它有着 70000 张规格较小的手写数字图片,由美国的高中生和美国人口调查局的职员手写而成。这相当于机器学习当中的“Hello World”,人们无论什么时候提出一个新的分类算法,都想知道该算法在这个数据集上的表现如何。机器学习的初学者迟早也会处理 MNIST 这个数据集。 Scikit-Learn 提供了许多辅助函数,以便于下载流行的数据集。MNIST 是其中一个。下面的代码获取 MNIST 12345678910111213>>> from sklearn.datasets im...

2020-09-26
ellipse_collection
椭圆集合绘制椭圆的集合。虽然使用 EllipseCollection 或PathCollection 同样可行,但使用EllipseCollection 可以实现更短的代码。 123456789101112131415161718192021222324252627import matplotlib.pyplot as pltimport numpy as npfrom matplotlib.collections import EllipseCollectionx = np.arange(10)y = np.arange(15)X, Y = np.meshgrid(x, y)XY = np.column_stack((X.ravel(), Y.ravel()))ww = X / 10.0hh = Y / 15.0aa = X * 9fig, ax = plt.subplots()ec = EllipseCollection(ww, hh, aa, units='x', offsets=XY, transOffset...

2021-04-06
MATLAB10
MATLAB的符号运算> MATLAB的符号运算 符号计算基础 符号变量和符号常量``` a = sym(‘a’),syms b,c = sym(‘3’) 符号表达式。生成方式,声明符号表达式中所有的变量为符号变量。或者直接使用sym函数生成一个符号表达式f = sym(字符串)。一些满足符号表达式的字符串能够自动转换为符号表达式 符号函数 simplify(多项式规则化简) simple(多种规则对多项式化简) sym()符号表达式和数值的转换使用eval()或者numeric函数。 因式分解函数factor(化简) , expand(展开) , collect(合并同类项) 符号矩阵。构建方式与数值矩阵相同,符号矩阵的运算同数值矩阵相同。 符号矩阵的转置transpose,determ ,’是共轭转置 subs(f1,3)使用3 代替原函数中的自变量,得到最终的结果。 符号极限,符号微分,符号积分 limit(y,0)计算y函数在零点的值 diff(y,3)微分求解 int(y3)求y3的积分函数 int(y...

2022-02-23
3 分析图形
分析图形基础处理分析图形的结构 G 可以使用各种图论函数进行分析,例如: 123456789G = nx.Graph()G.add_edges_from([(1, 2), (1, 3)])G.add_node("spam") # adds node "spam"list(nx.connected_components(G))[{1, 2, 3}, {'spam'}]sorted(d for n, d in G.degree())[0, 1, 1, 2]nx.clustering(G){1: 0, 2: 0, 3: 0, 'spam': 0} 一些具有大输出的函数迭代(节点、值)2元组。这些很容易存储在 dict 结构,如果你愿意的话。 123sp = dict(nx.all_pairs_shortest_path(G))sp[3]{3: [3], 1: [3, 1], 2: [3, 1, 2]} 图算法

2021-09-02
3-基本数据类型
3 基本数据类型基本数据类型包括:整型、浮点型、布尔型、字符串。 除以上基本类型之外,还有 数组、切片、结构体、函数、map、通道 等。 3.1 整型3.1.1 整型整型分为:int8、int16、int32、int64 ,以及对应的无符号整型:uint8、uint16、uint32、uint64 其中 unit8 对应其他语言中的 byte 类型;int16 对应 C 语言中的 short 类型;int64 对应 C 语言中的 long 类型。 各数据类型及对应的取值关系如下: 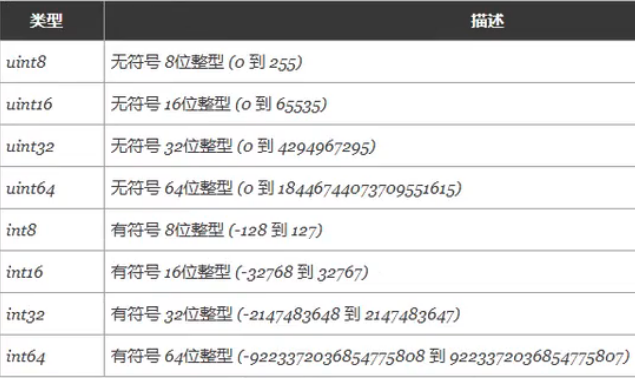 特殊整型: 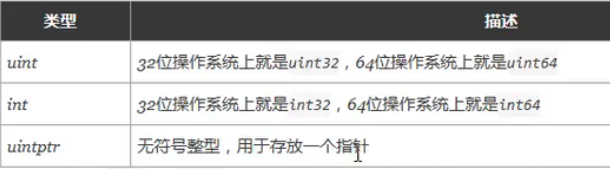 注意: 获取对象的长度时,内建的 len() 函数返回的长度可以根据不同平台的字节长度进行变化。实际使用中,切片或 map 的元素数量等都可以直接使用 int 来表示 。 3.1.2 八进制...

2020-09-02
2020.06.01-2020.08.30
文献整理——漏洞利用 一周后主动与夏老师交流,对当前的研究方向的困惑,以及存在的问题,是否修改当前的研究方向。唉,感觉,过去的半年,从来没有把这种研究放在心上,导致自己现在已经落后太多了,可能关键就在与研究方向的确定。其实想跟夏老师说明,自己并不想做漏洞利用,漏洞信息挖掘?数据采集?方面的还可以。群体智能与态势感知。对方向的迷惑才是最难的。基于群体智能的漏洞挖掘技术,能否成为一个很好的切入点呢? 读懂论文—–技术实现—–补充基础知识 1 Linux 内核漏洞利用生成关键技术研究关键名词(不太理解的基础知识) SMAP超级用户模式访问保护 栈迁移 汇编指令mov、pop、let 程序编译执行的内存空间:bss、data、code、heap、stack nmap、nessus。网络扫描工具和评估系统漏洞的工具 gcc编译器、gdb调试器以及nasm汇编器 栈金丝雀 模糊测试 符号执行 模型检测 污点分析 背景 漏洞 (vulnerability)是可以用来违反系统安全策略的缺陷或错误。 产生的原因:C/C++ 缺乏安全性检查->越界指针、悬空指针->内存破...


