
align_ylabels
对齐y标签
这里显示了两种方法,一种是使用对 Figure.align_ylabels 的简短调用,另一种是使用手动方式来对齐标签。
1 | import numpy as np |

另见 Figure.align_ylabels and Figure.align_labels for a direct method of doing the same thing. Also Aligning Labels
或者,我们可以使用y轴对象的set_label_coords方法手动在子图之间手动对齐轴标签。请注意,这需要我们知道硬编码的良好偏移值。
1 | fig, axs = plt.subplots(2, 2) |

参考
此示例中显示了以下函数,方法,类和模块的使用:
1 | import matplotlib |
下载这个示例
本博客所有文章除特别声明外,均采用 CC BY-NC-SA 4.0 许可协议。转载请注明来源 Estom的博客!
相关推荐
2021-03-20
4 使用 scikit-learn 对数据分类
第四章 使用 scikit-learn 对数据分类 作者:Trent Hauck 译者:飞龙 协议:CC BY-NC-SA 4.0 分类在大量语境下都非常重要。例如,如果我们打算自动化一些决策过程,我们可以利用分类。在我们需要研究诈骗的情况下,有大量的事务,人去检查它们是不实际的。所以,我们可以使用分类都自动化这种决策。 4.1 使用决策树实现基本的分类这个秘籍中,我们使用决策树执行基本的分类。它们是非常不错的模型,因为它们很易于理解,并且一旦训练完成,评估就很容易。通常可以使用 SQL 语句,这意味着结果可以由许多人使用。 准备这个秘籍中,我们会看一看决策树。我喜欢将决策树看做基类,大量的模型从中派生。它是个非常简单的想法,但是适用于大量的情况。 首先,让我们获取一些分类数据,我们可以使用它来练习: 123>>> from sklearn import datasets >>> X, y = datasets.make_classification(n_samples=1000, n_features=3, ...

2023-04-04
05 静态方法和单例模式
静态方法和非静态方法 静态方法和非静态方法,他们都是在第一次加载后就常驻内存,所以方法本身在内存里,没有什么区别 在内存中的区别是,非静态方法在创建实例对象时,因为属性的值对于每个对象都各不相同,因此在new一个实例时,会把这个实例属性在GC Heap里拷贝一份,同时这个new出来的对象放在堆栈上,堆栈指针指向了刚才拷贝的那一份实例的内存地址上。而静态方法则不需要,因为静态方法里面的静态 为什么要有非静态方法? 早期的结构化编程,几乎所有的方法都是“静态方法”,引入实例化方法概念是面向对象概念出现以后的事情了,区分静态方法和实例化方法不能单单从性能上去理解,创建c++,java,c#这样面向对象语言的大师引入实例化方法一定不是要解决什么性能、内存的问题,而是为了让开发更加模式化、面向对象化。这样说的话,静态方法和实例化方式的区分是为了解决模式的问题。 接下来继续思考,如果我们全部用静态方法,不用非静态方法,不是一样能实现功能吗?是的,没错,但是你的代码是基于对象,而不是面向对象的,因为面向对象的继承和多态,都是非静态方法。 第二个原因是为什么不建议都用静态方法,我们如果多线程的...

2021-03-04
6.高低地址与高低位
1 高低地址基础可以把主存看成一本空白的作业本,你现在要在笔记本上记录一些内容,他的页码排序是 1234第一页 : 0x0000001第二页 : 0x0000002...最后一页: 0x0000092 如果你选择从前向后记录(用完第一页,用第二页,类推)这就是先使用低地址,后使用高地址.业内表述:动态分配内存时堆空间向高地址增长,说的就是这种情况.这个向高地址增长就是先使用低地址,后使用高地址的意思. 10x0000001 -> 0x0000002-> ... -> 0x0000092 如果你选择从后往前记录(先用笔记本的最后一页,用完后使用倒数第二页,类推) 这就是先使用高地址,后使用低地址.业内表述:0xbfac 5000-0xbfad a000是栈空间,其中高地址的部分保存着进程的环境变量和命令行参数,低地址的部分保存函数栈帧,栈空间是向低地址增长的.这个向低地址增长就是先使用高地址,后使用低地址的意思. 10x0000092 -> ... ->0x0000002 -> 0x0000001 2 高低位基础 这个高地址与低地...

2023-11-26
03 批量操作
1 使用方法批量执行SQL语句批量执行 SQL 语句当需要成批插入或者更新记录时,可以采用 Java 的 批量 更新 机制,这一机制允许多条语句一次性提交给数据库批量处理。通常情况下比单独提交处理更有效率 JDBC 的批量处理语句包括下面三个方法: addBatch(String):添加需要批量处理的 SQL 语句或是参数; executeBatch():执行批量处理语句; clearBatch(): 清空缓存的数据 通常我们会遇到两种批量执行 SQL 语句的情况: 多条 SQL 语句的批量处理; 一个 SQL 语句的批量传参; 使用实例向数据表中插入20000条数据 实现层次一:使用 Statement123456Connection conn = JDBCUtils.getConnection();Statement st = conn.createStatement();for(int i = 1;i <= 20000;i++){ String sql = "insert into goods(name) values('name...
2021-04-08
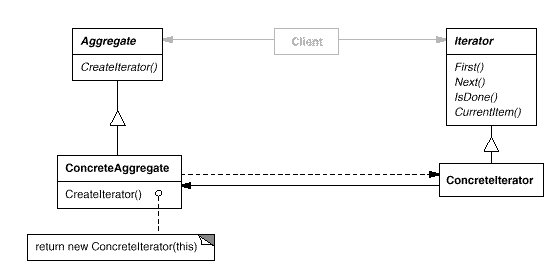
4.4 迭代器
迭代器概念意图提供一种方法顺序访问一个聚合对象中各个元素,而又不需暴露该对象的内部表示。 结构 参与者Iterator 迭代器定义访问和遍历元素的接口。 ConcreteIterator 具体迭代器实现迭代器接口。 对该聚合遍历时跟踪当前位置。 Aggregate 聚合定义创建相应迭代器对象的接口。 ConcreteAggregate 具体聚合实现创建相应迭代器的接口,该操作返回 ConreteIterator 的实例。 适用性在以下情况下可以使用 Iterator 模式: 访问一个聚合对象的内容而无需暴露它的内部表示。 支持对聚合对象的多种遍历。 为遍历不同的聚合结构提供一个统一的接口。 效果 它支持以不同的方式遍历一个聚合。 迭代器简化了聚合的接口。 在同一个聚合上可以有多个遍历。 相关模式 Iterator 常被应用到 Composite 这样的递归结构上。 可以使用 Factory Method 模式来实例化多态迭代器。 Iterator 可以使用 Memento 来捕获一个迭代的状态,在内部存储 Memento。 Imple...

2020-09-26
date
日期刻度标签演示如何使用日期刻度定位器和格式化程序在matplotlib中创建日期图。有关控制主要和次要刻度的更多信息,请参阅major_minor_demo1.py 所有matplotlib日期绘图都是通过将日期实例转换为自 0001-01-01 00:00:00 UTC 加上一天后的天数(由于历史原因)来完成的。 转换,刻度定位和格式化是在幕后完成的,因此这对您来说是最透明的。 日期模块提供了几个转换器函数 matplotlib.dates.date2num 和matplotlib.dates.num2date。这些可以在datetime.datetime 对象和 numpy.datetime64 对象之间进行转换。 1234567891011121314151617181920212223242526272829303132333435363738394041import numpy as npimport matplotlib.pyplot as pltimport matplotlib.dates as mdatesimport matplotlib.cbook as...


