
fig_axes_customize_simple
简单的图轴自定义
自定义简单绘图的背景,标签和刻度。
1 | import matplotlib.pyplot as plt |
用 plt.figure 创建一个 matplotlib.figure.Figure 实例
1 | fig = plt.figure() |

参考
此示例中显示了以下函数,方法,类和模块的使用:
1 | import matplotlib |
下载这个示例
本博客所有文章除特别声明外,均采用 CC BY-NC-SA 4.0 许可协议。转载请注明来源 Estom的博客!
相关推荐
2020-09-27
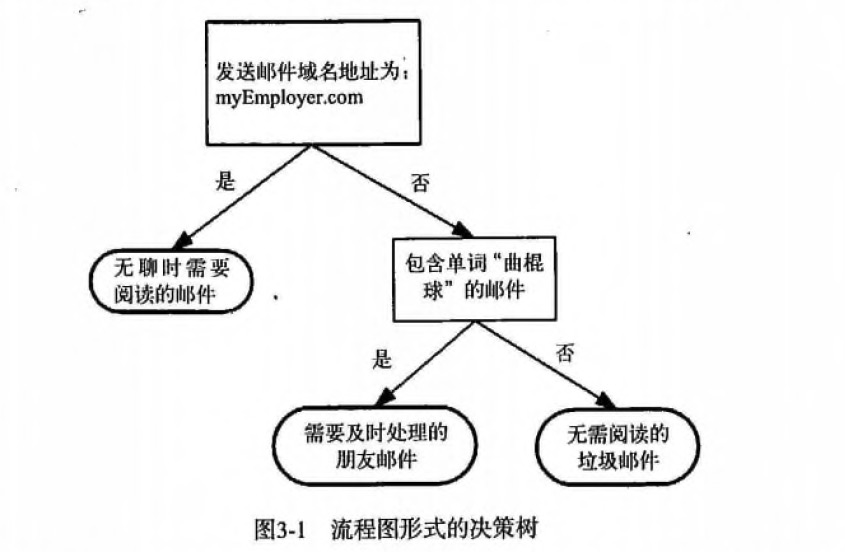
3.决策树
第3章 决策树1 决策树 概述决策树(Decision Tree)算法是一种基本的分类与回归方法,是最经常使用的数据挖掘算法之一。我们这章节只讨论用于分类的决策树。 决策树模型呈树形结构,在分类问题中,表示基于特征对实例进行分类的过程。它可以认为是 if-then 规则的集合,也可以认为是定义在特征空间与类空间上的条件概率分布。 决策树学习通常包括 3 个步骤: 特征选择、决策树的生成和决策树的修剪。 2 决策树 场景 一个叫做 “二十个问题” 的游戏,游戏的规则很简单: 参与游戏的一方在脑海中想某个事物,其他参与者向他提问,只允许提 20 个问题,问题的答案也只能用对或错回答。问问题的人通过推断分解,逐步缩小待猜测事物的范围,最后得到游戏的答案。 一个邮件分类系统,大致工作流程如下: 123首先检测发送邮件域名地址。如果地址为 myEmployer.com, 则将其放在分类 "无聊时需要阅读的邮件"中。如果邮件不是来自这个域名,则检测邮件内容里是否包含单词 "曲棍球" , 如果包含则将邮件归类到 "需要及时处理的朋友邮件...

2021-04-06
MATLAB10
MATLAB的符号运算> MATLAB的符号运算 符号计算基础 符号变量和符号常量``` a = sym(‘a’),syms b,c = sym(‘3’) 符号表达式。生成方式,声明符号表达式中所有的变量为符号变量。或者直接使用sym函数生成一个符号表达式f = sym(字符串)。一些满足符号表达式的字符串能够自动转换为符号表达式 符号函数 simplify(多项式规则化简) simple(多种规则对多项式化简) sym()符号表达式和数值的转换使用eval()或者numeric函数。 因式分解函数factor(化简) , expand(展开) , collect(合并同类项) 符号矩阵。构建方式与数值矩阵相同,符号矩阵的运算同数值矩阵相同。 符号矩阵的转置transpose,determ ,’是共轭转置 subs(f1,3)使用3 代替原函数中的自变量,得到最终的结果。 符号极限,符号微分,符号积分 limit(y,0)计算y函数在零点的值 diff(y,3)微分求解 int(y3)求y3的积分函数 int(y...
2021-03-16
11 递归与迭代
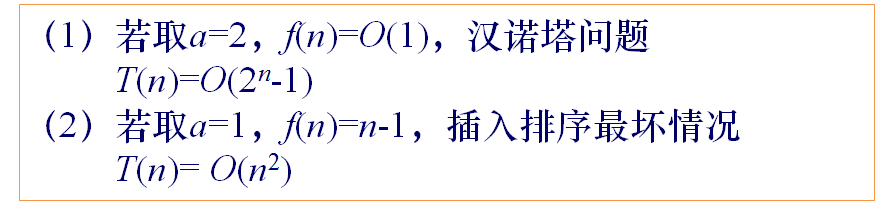
递归与迭代。 参考文献 递归详解 递归算法讲解 递归算法的理解 递归的本质 由于递归与迭代的特殊性。在这里单独列出一种思想。递归与迭代思想,用来处理所有的重复的操作。如分治法的相同子操作、动态规划的相同子操作、深度优先搜索、广度优先搜索的相同子操作。 1 递归法概述基本思想 直接或间接的调用自身的算法称为递归算法。用函数自身给出定义的函数称为递归函数。 递归的基本思想就是把规模大的问题转化为规模小的相似的子问题来解决。 递归的数学模型其实就是数学归纳法。可以用反向递推式表示递归的过程。(使用正向递推式表示循环的过程) 线性收缩递归算法 递推关系式 $$T(n)=\begin{cases} o(1) & n=1 \ \sum_{i=1}^k a_iT(n-i)+f(n) & n>1\end{cases}$$ 求解递推关系式$$T(n)=a^{n-1}T(1)+\sum_{i=2}^na^{n-i}f(i)$$ 关系式说明 等比收缩递归算法 递推关系式$$T(n)=\be...

2021-04-11
2 重新组织函数
2 重新组织函数1 Extract Method(提炼函数)概念Extract Method应该是最常用的重构手法了,当遇到一个过长的代码或者需要添加注释才能让人理解其用途的代码时,就可以运用Extract Method将代码提炼到一个函数上。该方法的一个重点时函数命名,只有给函数起个适当的名字时,他们才能真正起作用。对于是否使用该重构手法,代码长度不是问题,关键在于函数名称和函数本体之间的语义距离。 如果提炼可以强化代码的清晰度,那就去做,就算函数名称比提炼出来的代码还长也无所谓。 重构实例1123456789// 重构前void PrintOwing(double amount){ PrintBanner(); // print details cout << "name: " << m_name << endl; cout << "amount: " << amount << endl;} 123456789101112...

2020-09-26
multiprocess_sgskip
多进程演示使用多处理在一个过程中生成数据并在另一个过程中绘图。 由Robert Cimrman撰写 12345678import multiprocessing as mpimport timeimport matplotlib.pyplot as pltimport numpy as np# Fixing random state for reproducibilitynp.random.seed(19680801) 进程类此类绘制从管道接收的数据。 1234567891011121314151617181920212223242526272829303132class ProcessPlotter(object): def __init__(self): self.x = [] self.y = [] def terminate(self): plt.close('all') def call_back(self): while self.pipe.poll(): ...

2020-09-26
collections
具有自动缩放功能的Line,Poly和RegularPoly Collection对于前两个子图,我们将使用螺旋。它们的大小将以图表单位设置,而不是数据单位。它们的位置将通过使用LineCollection和PolyCollection的“偏移”和“transOffset”kwargs以数据单位设置。 第三个子图将生成正多边形,具有与前两个相同类型的缩放和定位。 最后一个子图说明了使用 “offsets =(xo,yo)”,即单个元组而不是元组列表来生成连续的偏移曲线,其中偏移量以数据单位给出。 此行为仅适用于LineCollection。 123456789101112131415161718192021222324252627282930313233343536373839404142434445464748495051525354555657585960616263646566676869707172737475767778798081828384858687888990919293949596979899100101102103104105106107impor...


