
power_norm
探索规范化
多元正态分布的各种归一化。
1 | import matplotlib.pyplot as plt |

参考
此示例中显示了以下函数,方法,类和模块的使用:
1 | import matplotlib |
下载这个示例
本博客所有文章除特别声明外,均采用 CC BY-NC-SA 4.0 许可协议。转载请注明来源 Estom的博客!
相关推荐

2020-09-26
radar_chart
雷达图(又名蜘蛛星图)此示例创建雷达图表,也称为蜘蛛星图。 虽然此示例允许“圆”或“多边形”的框架,但多边形框架没有合适的网格线(线条是圆形而不是多边形)。 通过将matplotlib.axis中的GRIDLINE_INTERPOLATION_STEPS设置为所需的顶点数,可以获得多边形网格,但多边形的方向不与径向轴对齐。 http://en.wikipedia.org/wiki/Radar_chart 12345678910111213141516171819202122232425262728293031323334353637383940414243444546474849505152535455565758596061626364656667686970717273747576777879808182838485868788899091929394959697989910010110210310410510610710810911011111211311411511611711811912012112212312412512612712812913013113213313...

2021-03-22
44 分布式RPC框架
分布式 RPC 框架入门 原文:https://pytorch.org/tutorials/intermediate/rpc_tutorial.html 作者:Shen Li 先决条件: PyTorch 分布式概述 RPC API 文档 本教程使用两个简单的示例来演示如何使用torch.distributed.rpc包构建分布式训练,该包首先在 PyTorch v1.4 中作为原型功能引入。 这两个示例的源代码可以在 PyTorch 示例中找到。 先前的教程分布式数据并行入门和使用 PyTorch 编写分布式应用,描述了DistributedDataParallel,该模型支持特定的训练范例,该模型可在多个进程之间复制,每个进程都处理输入数据的拆分。 有时,您可能会遇到需要不同训练范例的场景。 例如: 在强化学习中,从环境中获取训练数据可能相对昂贵,而模型本身可能很小。 在这种情况下,产生多个并行运行的观察者并共享一个智能体可能会很有用。 在这种情况下,智能体将在本地负责训练,但是应用仍将需要库在观察者和训练者之间发送和接收数据。 您的模型可能太大,无法容纳在一台计算机上...

2020-09-26
legend
使用预定义标签的图例使用图定义图例标签。 1234567891011121314151617181920import numpy as npimport matplotlib.pyplot as plt# Make some fake data.a = b = np.arange(0, 3, .02)c = np.exp(a)d = c[::-1]# Create plots with pre-defined labels.fig, ax = plt.subplots()ax.plot(a, c, 'k--', label='Model length')ax.plot(a, d, 'k:', label='Data length')ax.plot(a, c + d, 'k', label='Total message length')legend = ax.legend(loc='upper center', shadow=True, fon...
2021-03-20
12
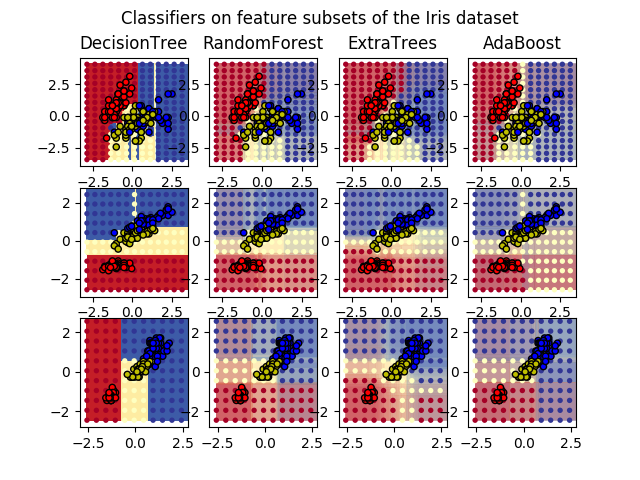
1.11. 集成方法校验者: @Dream on dreamer. @zehuichen123 @JanzenLiu @小瑶 @\S^R^Y/ @Loopy @qinhanmin2014翻译者: @StupidStalker @文谊 @t9UhoI 注意:在本文中 bagging 和 boosting 为了更好的保留原文意图,不进行翻译estimator:估计器 base estimator:基估计器 集成方法 的目标是把多个使用给定学习算法构建的基估计器的预测结果结合起来,从而获得比单个估计器更好的泛化能力/鲁棒性。 集成方法通常分为两种: 平均方法,该方法的原理是构建多个独立的估计器,然后取它们的预测结果的平均。一般来说组合之后的估计器是会比单个估计器要好的,因为它的方差减小了。 示例: Bagging 方法 , 随机森林 , … 相比之下,在 boosting 方法 中,基估计器是依次构建的,并且每一个基估...

2020-09-26
fig_x
X图添加线条到图形(没有轴)。 12345678910111213import matplotlib.pyplot as pltimport matplotlib.lines as linesfig = plt.figure()l1 = lines.Line2D([0, 1], [0, 1], transform=fig.transFigure, figure=fig)l2 = lines.Line2D([0, 1], [1, 0], transform=fig.transFigure, figure=fig)fig.lines.extend([l1, l2])plt.show() 参考此示例中显示了以下函数,方法,类和模块的使用: 1234import matplotlibmatplotlib.pyplot.figurematplotlib.linesmatplotlib.lines.Line2D 下载这个示例 下载python源码: fig_x.py 下载Jupyter notebook: fig_x.ipynb

2021-03-09
scrapy视频学习
spider 的使用说明: 继承scrapy.spider name spider的名字 start_urls初始链接 request 发送请求并且捕获相应,通过回调函数parse处理response相应 request函数能够发送请求,request函数需要一个回调函数,来接受请求。默认的request函数调用了parse,但是在多次request中,需要设置不同的parse函数,来处理多次请求 python回调函数的意思就是在一个函数的某个地方通过一个函数指针,调用另外一个函数,使得函数跳转。因为python是脚本,所以,在没有返回值的python函数执行时,如果函数跳转到其他地方,并不会返回一个值到原来的地方。 轮换useragent的目的: 当你使用同一个浏览器的时候(同一个useragent)会因为过度浪费服务器资源而被禁掉。 scrapy的一些内置特性: scrapy内置的数据抽取其:css/xpath/re scrapy内置结果的输出:csv,xml,json 自动处理编码 有丰富的内置扩展 cookies session 客户端和服务器端的缓存...


