
symlog_demo
Symlog演示
示例使用symlog(对称对数)轴缩放。

1 | import matplotlib.pyplot as plt |
下载这个示例
本博客所有文章除特别声明外,均采用 CC BY-NC-SA 4.0 许可协议。转载请注明来源 Estom的博客!
相关推荐

2021-09-07
basics_of_libuv
Basics of libuvlibuv强制使用异步和事件驱动的编程风格。它的核心工作是提供一个event-loop,还有基于I/O和其它事件通知的回调函数。libuv还提供了一些核心工具,例如定时器,非阻塞的网络支持,异步文件系统访问,子进程等。 Event loops在事件驱动编程中,程序会关注每一个事件,并且对每一个事件的发生做出反应。libuv会负责将来自操作系统的事件收集起来,或者监视其他来源的事件。这样,用户就可以注册回调函数,回调函数会在事件发生的时候被调用。event-loop会一直保持运行状态。用伪代码描述如下: 1234while there are still events to process: e = get the next event if there is a callback associated with e: call the callback 举几个事件的例子: 准备好被写入的文件。 包含准备被读取的数据的socket。 超时的定时器。 event-loop最终会被uv_ru...

2022-12-04
04-动态绑定属性
# 1. v-bind的基本使用 某些时候我们并不想将变量放在标签内容中,像这样`{{message}}`是将变量h2标签括起来,类似js的innerHTML。但是我们期望将变量`imgURL`写在如下位置,想这样``导入图片是希望动态获取图片的链接,此时的imgURL并非变量而是字符串imgURL,如果要将其生效为变量,需要使用到一个标签`v-bind:`,像这样``,而且这里也不能使用Mustache语法,类似``,这也是错误的。 123456789101112131415161718192021222324252627282930313233<!DOCTYPE html><html lang="en"><head> <meta charset="UTF-8"> <meta name="viewport" content="width=device-width, initial-scale=1.0&q...

2021-12-24
read
read从键盘读取变量值 补充说明read命令 从键盘读取变量的值,通常用在shell脚本中与用户进行交互的场合。该命令可以一次读取多个变量的值,变量和输入的值都需要使用空格隔开。在read命令后面,如果没有指定变量名,读取的数据将被自动赋值给特定的变量REPLY 语法1read(选项)(参数) 选项12-p:指定读取值时的提示符;-t:指定读取值时等待的时间(秒)。 参数变量:指定读取值的变量名。 实例下面的列表给出了read命令的常用方式: 12read 1987name从标准输入读取输入并赋值给变量1987name。 12read first last从标准输入读取输入到第一个空格或者回车,将输入的第一个单词放到变量first中,并将该行其他的输入放在变量last中。 12read从标准输入读取一行并赋值给特定变量REPLY。 12read -a arrayname把单词清单读入arrayname的数组里。 12read -p "text"打印提示(text),等待输入,并将输入存储在REPLY中。 12read -r line允许输入包含...
2021-04-07
22 二进制数组
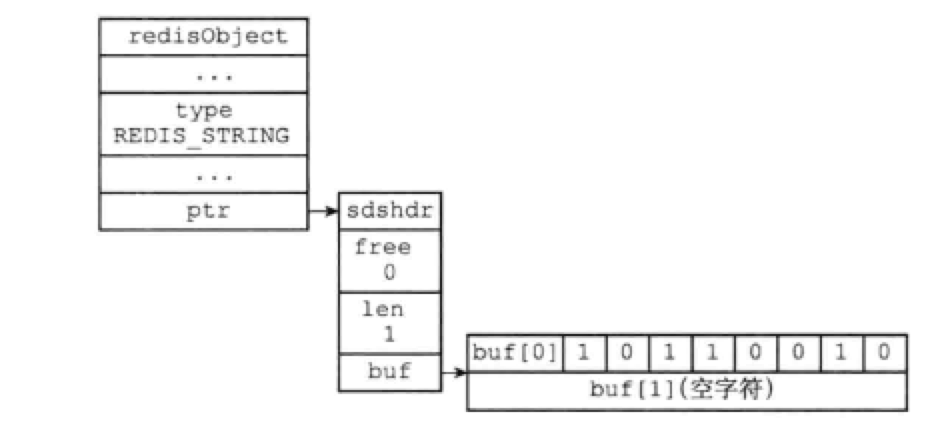
Redis提供了SETBIT、GETBIT、BITCOUNT、BITOP四个命令用于处理二进制位数组。 SETBIT,为位数组指定偏移量上的二进制位设置值0或1。 GETBIT,获取位数组指定偏移量上的二进制位的值。 BITCOUNT,统计位数组中1的个数。 BITOP,既可以对多个位数组进行按位与、按位或、按位异或运算,也可以对给定位数组取反。 22.1 位数组的表示Redis使用字符串来表示位数组,并使用SDS结构的操作函数来处理位数组。 redisObject.type的值为REDIS_STRING,表示字符串对象。 sdshdr.len值为1,表示这个SDS保存了一个一字节长的位数组。 buf数组的buf[0]字节保存了一个一字节长的位数组。 buf数组的buf[1]字节保存了SDS程序自动追加到值的末尾的’\0’。 22.2 GETBIT命令的实现 GETBIT 用于返回位数组bitarray在offset偏移量上的二进制位的值: 计算 byte = (offset / 8),byte记录了offset偏移量指定的二进制保存在位数组的哪个字节。 计算 ...
2021-03-20
AI学习路线
基础知识 1.数学数学是学不完的,也没有几个人能像博士一样扎实地学好数学基础,入门人工智能领域,其实只需要掌握必要的基础知识就好。AI的数学基础最主要是高等数学、线性代数、概率论与数理统计三门课程,这三门课程是本科必修的。这里整理了一个简易的数学入门文章。数学基础: 高等数学https://zhuanlan.zhihu.com/p/36311622数学基础: 线性代数https://zhuanlan.zhihu.com/p/36584206数学基础: 概率论与数理统计https://zhuanlan.zhihu.com/p/36584335 机器学习的数学基础资料下载:1.机器学习的数学基础.docx中文版,对高等数学、线性代数、概率论与数理统计三门课的公式做了总结2) 斯坦福大学机器学习的数学基础.pdf原版英文材料,非常全面,建议英语好的同学直接学习这个材料下载链接: https://pan.baidu.com/s/1LaUlrJzy98CG1Wma9FgBtg 提取码: hktx 推荐教材相比国内浙大版和同济版的数学教材,通俗易懂,便于初学者更好地奠定数学基础下载链接: ...

2021-06-03
3 类图
1 类元素元素声明12345678910111213@startumlabstract abstractabstract class "abstract class"annotation annotationcircle circle() circle_short_formclass classdiamond diamond<> diamond_short_formentity entityenum enuminterface interface@enduml 2 类间关系基本关系 虚线箭头指向依赖; 实线箭头指向关联; 虚线三角指向接口; 实线三角指向父类; 空心菱形能分离而独立存在,是聚合; 实心菱形精密关联不可分,是组合; 1234567891011121314@startumlClass01 <|-- Class02Class01 <|.....


