
line_collection
线段集合
使用Matplotlib绘制线条。
LineCollection 允许在图上绘制多条线。 下面我们展示它的一些属性。
1 | import matplotlib.pyplot as plt |

为了在一组轴中有效地绘制多条线,Matplotlib能够一次性添加所有线。 这是一个简单的例子,展示了它是如何完成的。
1 | N = 50 |

参考
此示例中显示了以下函数,方法,类和模块的使用:
1 | import matplotlib |
下载这个示例
https://estom.github.io/2020/09/26/Python/matplotlab/gallery/shapes_and_collections/line_collection/
本博客所有文章除特别声明外,均采用 CC BY-NC-SA 4.0 许可协议。转载请注明来源 Estom的博客!
相关推荐

2019-11-30
7 函数
方法函数1 方法与函数关系Scala 有方法与函数,二者在语义上的区别很小。Scala 方法是类的一部分,而函数是一个对象可以赋值给一个变量。换句话来说在类中定义的函数即是方法。 Scala 中的方法跟 Java 的类似,方法是组成类的一部分。 Scala 中的函数则是一个完整的对象,Scala 中的函数其实就是继承了 Trait 的类的对象。 Scala 中使用 val 语句可以定义函数,def 语句定义方法。 class Test{ def m(x: Int) = x + 3 val f = (x: Int) => x + 3} 2 函数类型变量混合式val f1 = (x:Int,y:Int)=>x*y 类型变量分离式val f2:(Int,Int)=>Int = (x,y)=>x*y 3 方法方法声明Scala 方法声明格式如下: def functionName ([参数列表]) : [return type]如果你不写等于号和方法主体,那么方法会被隐式声明为抽象...
2021-03-20
15
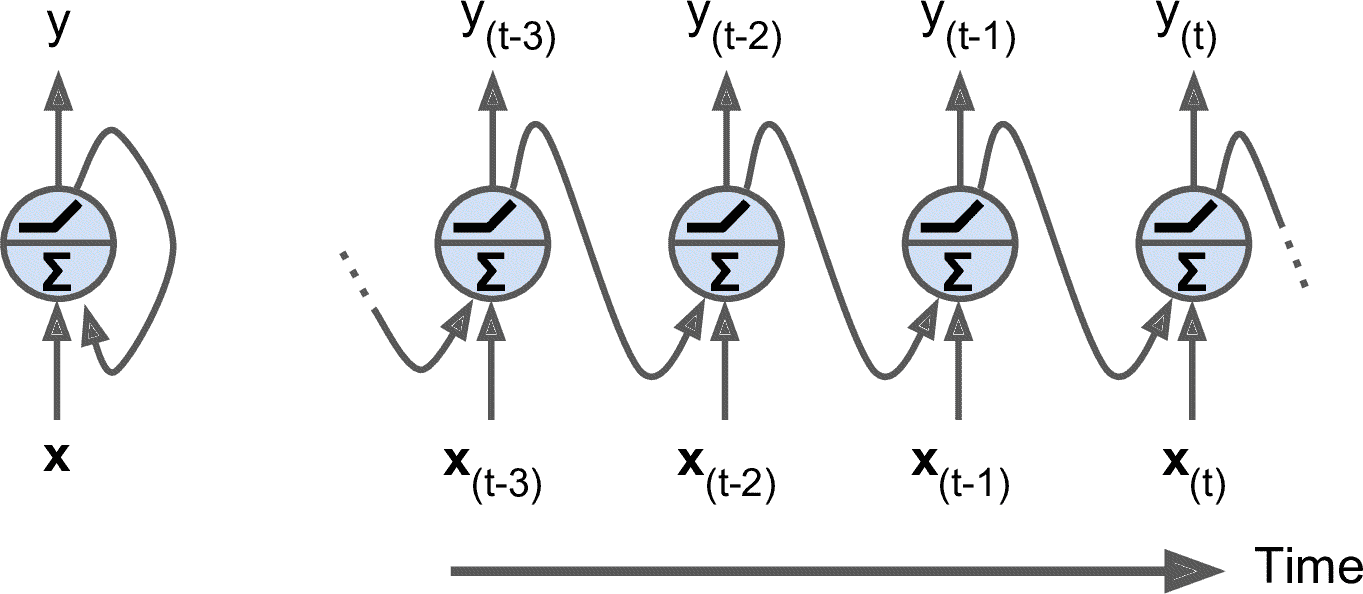
十五、使用 RNN 和 CNN 处理序列 译者:@SeanCheney 击球手击出垒球,外场手会立即开始奔跑,并预测球的轨迹。外场手追踪球,不断调整移动步伐,最终在观众的掌声中抓到它。无论是在听完朋友的话还是早餐时预测咖啡的味道,你时刻在做的事就是在预测未来。在本章中,我们将讨论循环神经网络,一类可以预测未来的网络(当然,是到某一点为止)。它们可以分析时间序列数据,比如股票价格,并告诉你什么时候买入和卖出。在自动驾驶系统中,他们可以预测行车轨迹,避免发生事故。更一般地说,它们可在任意长度的序列上工作,而不是截止目前我们讨论的只能在固定长度的输入上工作的网络。举个例子,它们可以将语句,文件,以及语音范本作为输入,应用在在自动翻译,语音到文本的自然语言处理应用中。 在本章中,我们将学习循环神经网络的基本概念,如何使用时间反向传播训练网络,然后用来预测时间序列。然后,会讨论 RNN 面对的两大难点: 不稳定梯度(换句话说,在第 11 章中讨论的梯度消失/爆炸),可以使用多种方法缓解,包括循环丢弃和循环层归一化。 有限的短期记忆,可以通过 LSTM 和 GRU 单元延长。...

2020-09-26
colorbar_basics
颜色条通过指定可映射对象(此处为imshow返回的 AxesImage )和要将颜色条附加到的轴来使用 colorbar。 1234567891011121314151617181920212223242526272829303132333435import numpy as npimport matplotlib.pyplot as plt# setup some generic dataN = 37x, y = np.mgrid[:N, :N]Z = (np.cos(x*0.2) + np.sin(y*0.3))# mask out the negative and positive values, respectivelyZpos = np.ma.masked_less(Z, 0)Zneg = np.ma.masked_greater(Z, 0)fig, (ax1, ax2, ax3) = plt.subplots(figsize=(13, 3), ncols=3)# plot just the positive data and save the# color "...

2020-09-25
5interpolate
定义插值是在直线或曲线上的两点之间找到值的过程。 为了帮助记住它的含义,我们应该将“inter”这个词的第一部分想象为“输入”,表示要查看原来数据的“内部”。 这种插值工具不仅适用于统计学,而且在科学,商业或需要预测两个现有数据点内的值时也很有用。 123456789import numpy as npfrom scipy import interpolateimport matplotlib.pyplot as pltx = np.linspace(0, 4, 12)y = np.cos(x**2/3+4)plt.plot(x, y,’o’)plt.show() 一维插值一维插值scipy.interpolate中的interp1d类是一种创建基于固定数据点的函数的便捷方法,可以使用线性插值在给定数据定义的域内的任意位置评估该函数。通过使用上述数据,创建一个插值函数并绘制一个新的插值图。 12345f1 = interp1d(x, y,kind = 'linear')f2 = interp1d(x, y, kind = 'cubic'

2020-09-26
annotation_basic
注释一个图像此示例显示如何使用指向提供的坐标的箭头注释绘图。我们修改箭头的默认值,以“缩小”它。 有关注释功能的完整概述,另请参阅注释教程。 1234567891011121314import numpy as npimport matplotlib.pyplot as pltfig, ax = plt.subplots()t = np.arange(0.0, 5.0, 0.01)s = np.cos(2*np.pi*t)line, = ax.plot(t, s, lw=2)ax.annotate('local max', xy=(2, 1), xytext=(3, 1.5), arrowprops=dict(facecolor='black', shrink=0.05), )ax.set_ylim(-2, 2)plt.show() 参考此示例中显示了以下函数,方法,类和模块的使用: 123import matplotlibmatplotlib.axes.Axes.annotatematplo...

2020-09-26
contour_corner_mask
等高线角遮盖此示例中显示了以下函数,方法和类的使用: 123456789101112131415161718192021222324252627282930import matplotlib.pyplot as pltimport numpy as np# Data to plot.x, y = np.meshgrid(np.arange(7), np.arange(10))z = np.sin(0.5 * x) * np.cos(0.52 * y)# Mask various z values.mask = np.zeros_like(z, dtype=bool)mask[2, 3:5] = Truemask[3:5, 4] = Truemask[7, 2] = Truemask[5, 0] = Truemask[0, 6] = Truez = np.ma.array(z, mask=mask)corner_masks = [False, True]fig, axs = plt.subplots(ncols=2)for ax, corner_mask in zip(axs, c...


