
patch_collection
圆,楔和多边形
此示例演示如何使用修补程序集合。
1 | import numpy as np |

参考
此示例中显示了以下函数,方法,类和模块的使用:
1 | import matplotlib |
下载这个示例
本博客所有文章除特别声明外,均采用 CC BY-NC-SA 4.0 许可协议。转载请注明来源 Estom的博客!
相关推荐

2020-09-02
2020.06.01-2020.08.30
文献整理——漏洞利用 一周后主动与夏老师交流,对当前的研究方向的困惑,以及存在的问题,是否修改当前的研究方向。唉,感觉,过去的半年,从来没有把这种研究放在心上,导致自己现在已经落后太多了,可能关键就在与研究方向的确定。其实想跟夏老师说明,自己并不想做漏洞利用,漏洞信息挖掘?数据采集?方面的还可以。群体智能与态势感知。对方向的迷惑才是最难的。基于群体智能的漏洞挖掘技术,能否成为一个很好的切入点呢? 读懂论文—–技术实现—–补充基础知识 1 Linux 内核漏洞利用生成关键技术研究关键名词(不太理解的基础知识) SMAP超级用户模式访问保护 栈迁移 汇编指令mov、pop、let 程序编译执行的内存空间:bss、data、code、heap、stack nmap、nessus。网络扫描工具和评估系统漏洞的工具 gcc编译器、gdb调试器以及nasm汇编器 栈金丝雀 模糊测试 符号执行 模型检测 污点分析 背景 漏洞 (vulnerability)是可以用来违反系统安全策略的缺陷或错误。 产生的原因:C/C++ 缺乏安全性检查->越界指针、悬空指针->内存破...
2021-03-20
10
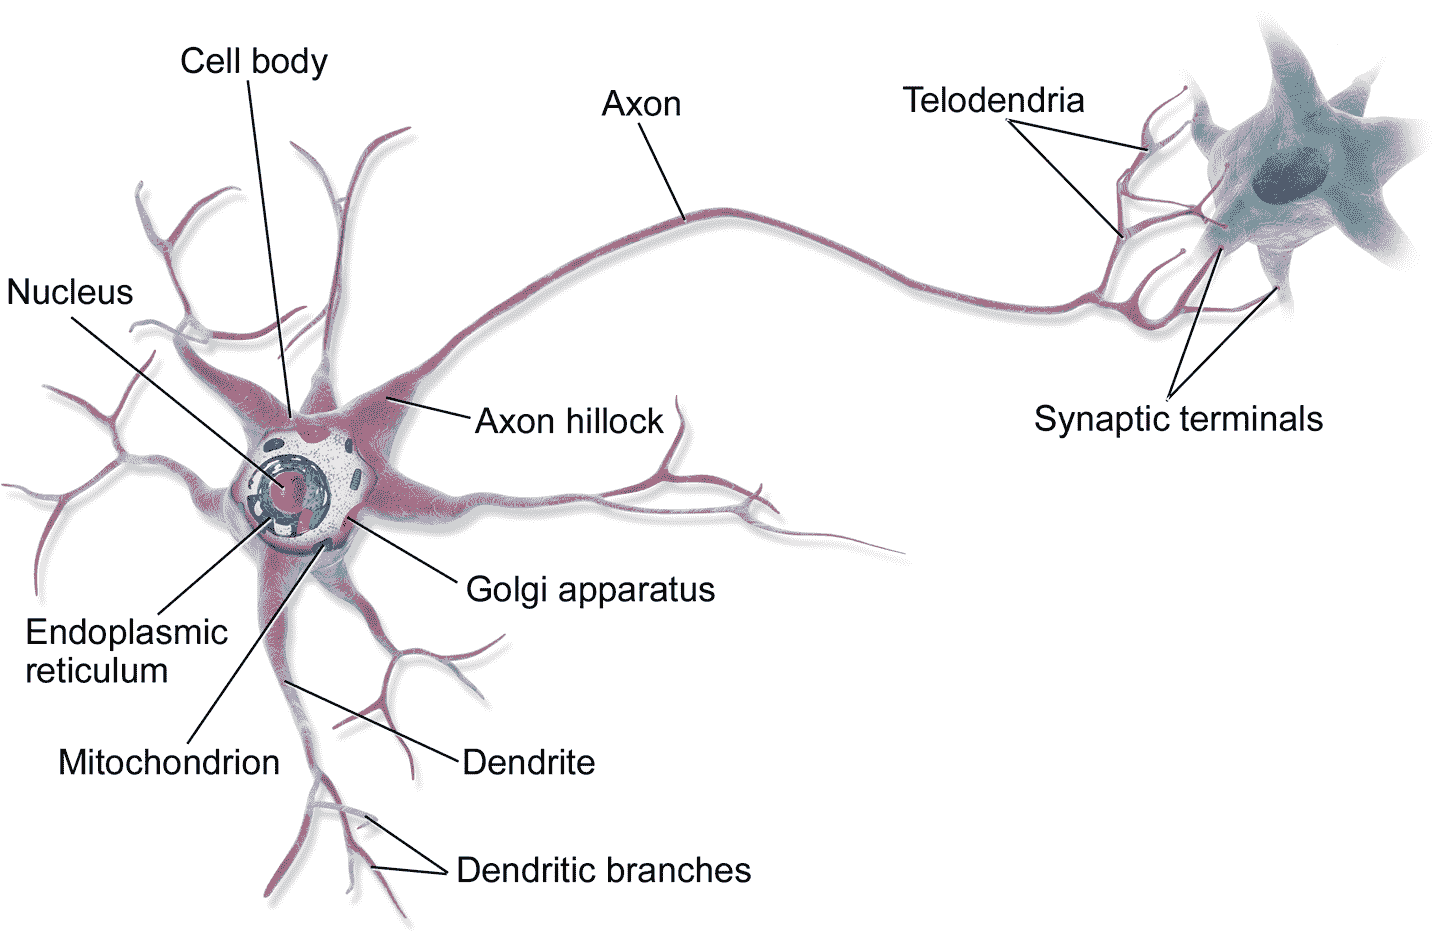
十、使用 Keras 搭建人工神经网络 译者:@SeanCheney 鸟类启发人类飞翔,东洋参启发了魔术贴的发明,大自然启发人类实现了无数发明创造。通过研究大脑来制造智能机器,也符合这个逻辑。人工神经网络(ANN)就是沿着这条逻辑诞生的:人工神经网络是受大脑中的生物神经元启发而来的机器学习模型。但是,虽然飞机是受鸟儿启发而来的,飞机却不用挥动翅膀。相似的,人工神经网络和生物神经元网络也是具有不同点的。一些研究者甚至认为,应该彻底摒弃这种生物学类比:例如,用“单元”取代“神经元”,以免人们将创造力局限于生物学系统的合理性上。 人工神经网络是深度学习的核心,它不仅样式多样、功能强大,还具有可伸缩性,这让人工神经网络适宜处理庞大且复杂的机器学习任务,例如对数十亿张图片分类(谷歌图片)、语音识别(苹果 Siri)、向数亿用户每天推荐视频(Youtube)、或者通过学习几百围棋世界冠军(DeepMind 的 AlphaGo)。 本章的第一部分会介绍人工神经网络,从一个简单的 ANN 架构开始,然后过渡到多层感知机(MLP),后者的应用非常广泛(后面的章节会介绍其他的架构)。第二部分会介绍...

2020-09-26
watermark_image
图像水印使用PNG文件作为水印。 123456789101112131415161718192021import numpy as npimport matplotlib.cbook as cbookimport matplotlib.image as imageimport matplotlib.pyplot as plt# Fixing random state for reproducibilitynp.random.seed(19680801)datafile = cbook.get_sample_data('logo2.png', asfileobj=False)print('loading %s' % datafile)im = image.imread(datafile)im[:, :, -1] = 0.5 # set the alpha channelfig, ax = plt.subplots()ax.plot(np.random.rand(20), '-o', ms=20, lw=2, alpha=...
2020-09-27
3.决策树
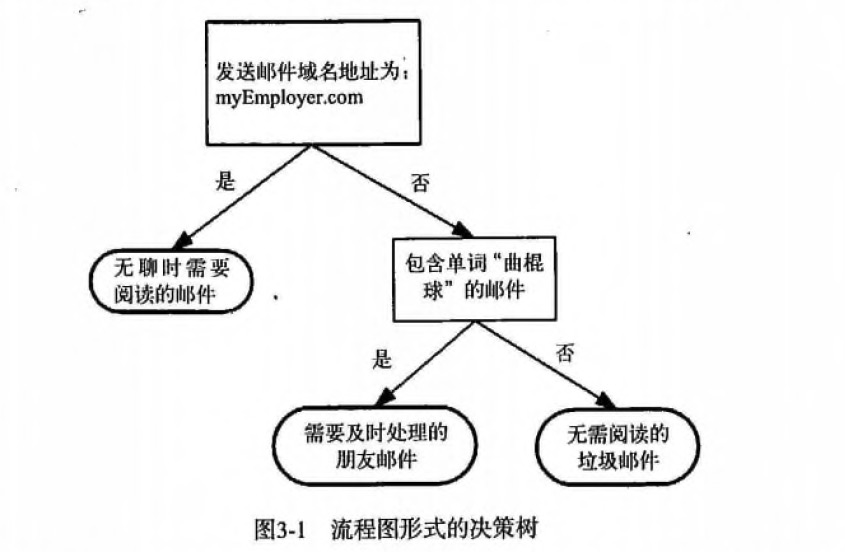
第3章 决策树1 决策树 概述决策树(Decision Tree)算法是一种基本的分类与回归方法,是最经常使用的数据挖掘算法之一。我们这章节只讨论用于分类的决策树。 决策树模型呈树形结构,在分类问题中,表示基于特征对实例进行分类的过程。它可以认为是 if-then 规则的集合,也可以认为是定义在特征空间与类空间上的条件概率分布。 决策树学习通常包括 3 个步骤: 特征选择、决策树的生成和决策树的修剪。 2 决策树 场景 一个叫做 “二十个问题” 的游戏,游戏的规则很简单: 参与游戏的一方在脑海中想某个事物,其他参与者向他提问,只允许提 20 个问题,问题的答案也只能用对或错回答。问问题的人通过推断分解,逐步缩小待猜测事物的范围,最后得到游戏的答案。 一个邮件分类系统,大致工作流程如下: 123首先检测发送邮件域名地址。如果地址为 myEmployer.com, 则将其放在分类 "无聊时需要阅读的邮件"中。如果邮件不是来自这个域名,则检测邮件内容里是否包含单词 "曲棍球" , 如果包含则将邮件归类到 "需要及时处理的朋友邮件...

2020-09-26
hist
直方图演示如何使用matplotlib绘制直方图。 1234567import matplotlib.pyplot as pltimport numpy as npfrom matplotlib import colorsfrom matplotlib.ticker import PercentFormatter# Fixing random state for reproducibilitynp.random.seed(19680801) 生成数据并绘制简单的直方图要生成一维直方图,我们只需要一个数字矢量。对于二维直方图,我们需要第二个矢量。我们将在下面生成两者,并显示每个向量的直方图。 123456789101112N_points = 100000n_bins = 20# Generate a normal distribution, center at x=0 and y=5x = np.random.randn(N_points)y = .4 * x + np.random.randn(100000) + 5fig, axs = plt.subplots(1, 2, ...
2021-03-16
11 递归与迭代
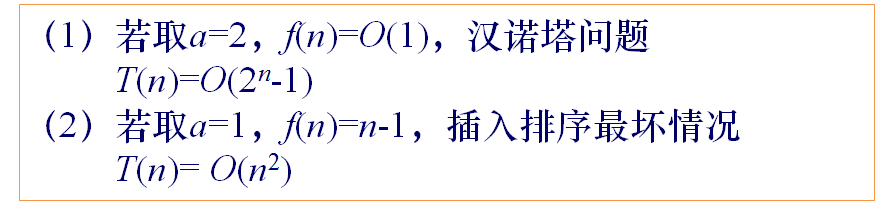
递归与迭代。 参考文献 递归详解 递归算法讲解 递归算法的理解 递归的本质 由于递归与迭代的特殊性。在这里单独列出一种思想。递归与迭代思想,用来处理所有的重复的操作。如分治法的相同子操作、动态规划的相同子操作、深度优先搜索、广度优先搜索的相同子操作。 1 递归法概述基本思想 直接或间接的调用自身的算法称为递归算法。用函数自身给出定义的函数称为递归函数。 递归的基本思想就是把规模大的问题转化为规模小的相似的子问题来解决。 递归的数学模型其实就是数学归纳法。可以用反向递推式表示递归的过程。(使用正向递推式表示循环的过程) 线性收缩递归算法 递推关系式 $$T(n)=\begin{cases} o(1) & n=1 \ \sum_{i=1}^k a_iT(n-i)+f(n) & n>1\end{cases}$$ 求解递推关系式$$T(n)=a^{n-1}T(1)+\sum_{i=2}^na^{n-i}f(i)$$ 关系式说明 等比收缩递归算法 递推关系式$$T(n)=\be...


