
anatomy
解剖图
下图显示了组成一个图的几个matplotlib元素的名称。

1 | import numpy as np |
下载这个示例
本博客所有文章除特别声明外,均采用 CC BY-NC-SA 4.0 许可协议。转载请注明来源 Estom的博客!
相关推荐
2021-03-26
18 数组离散化的方法
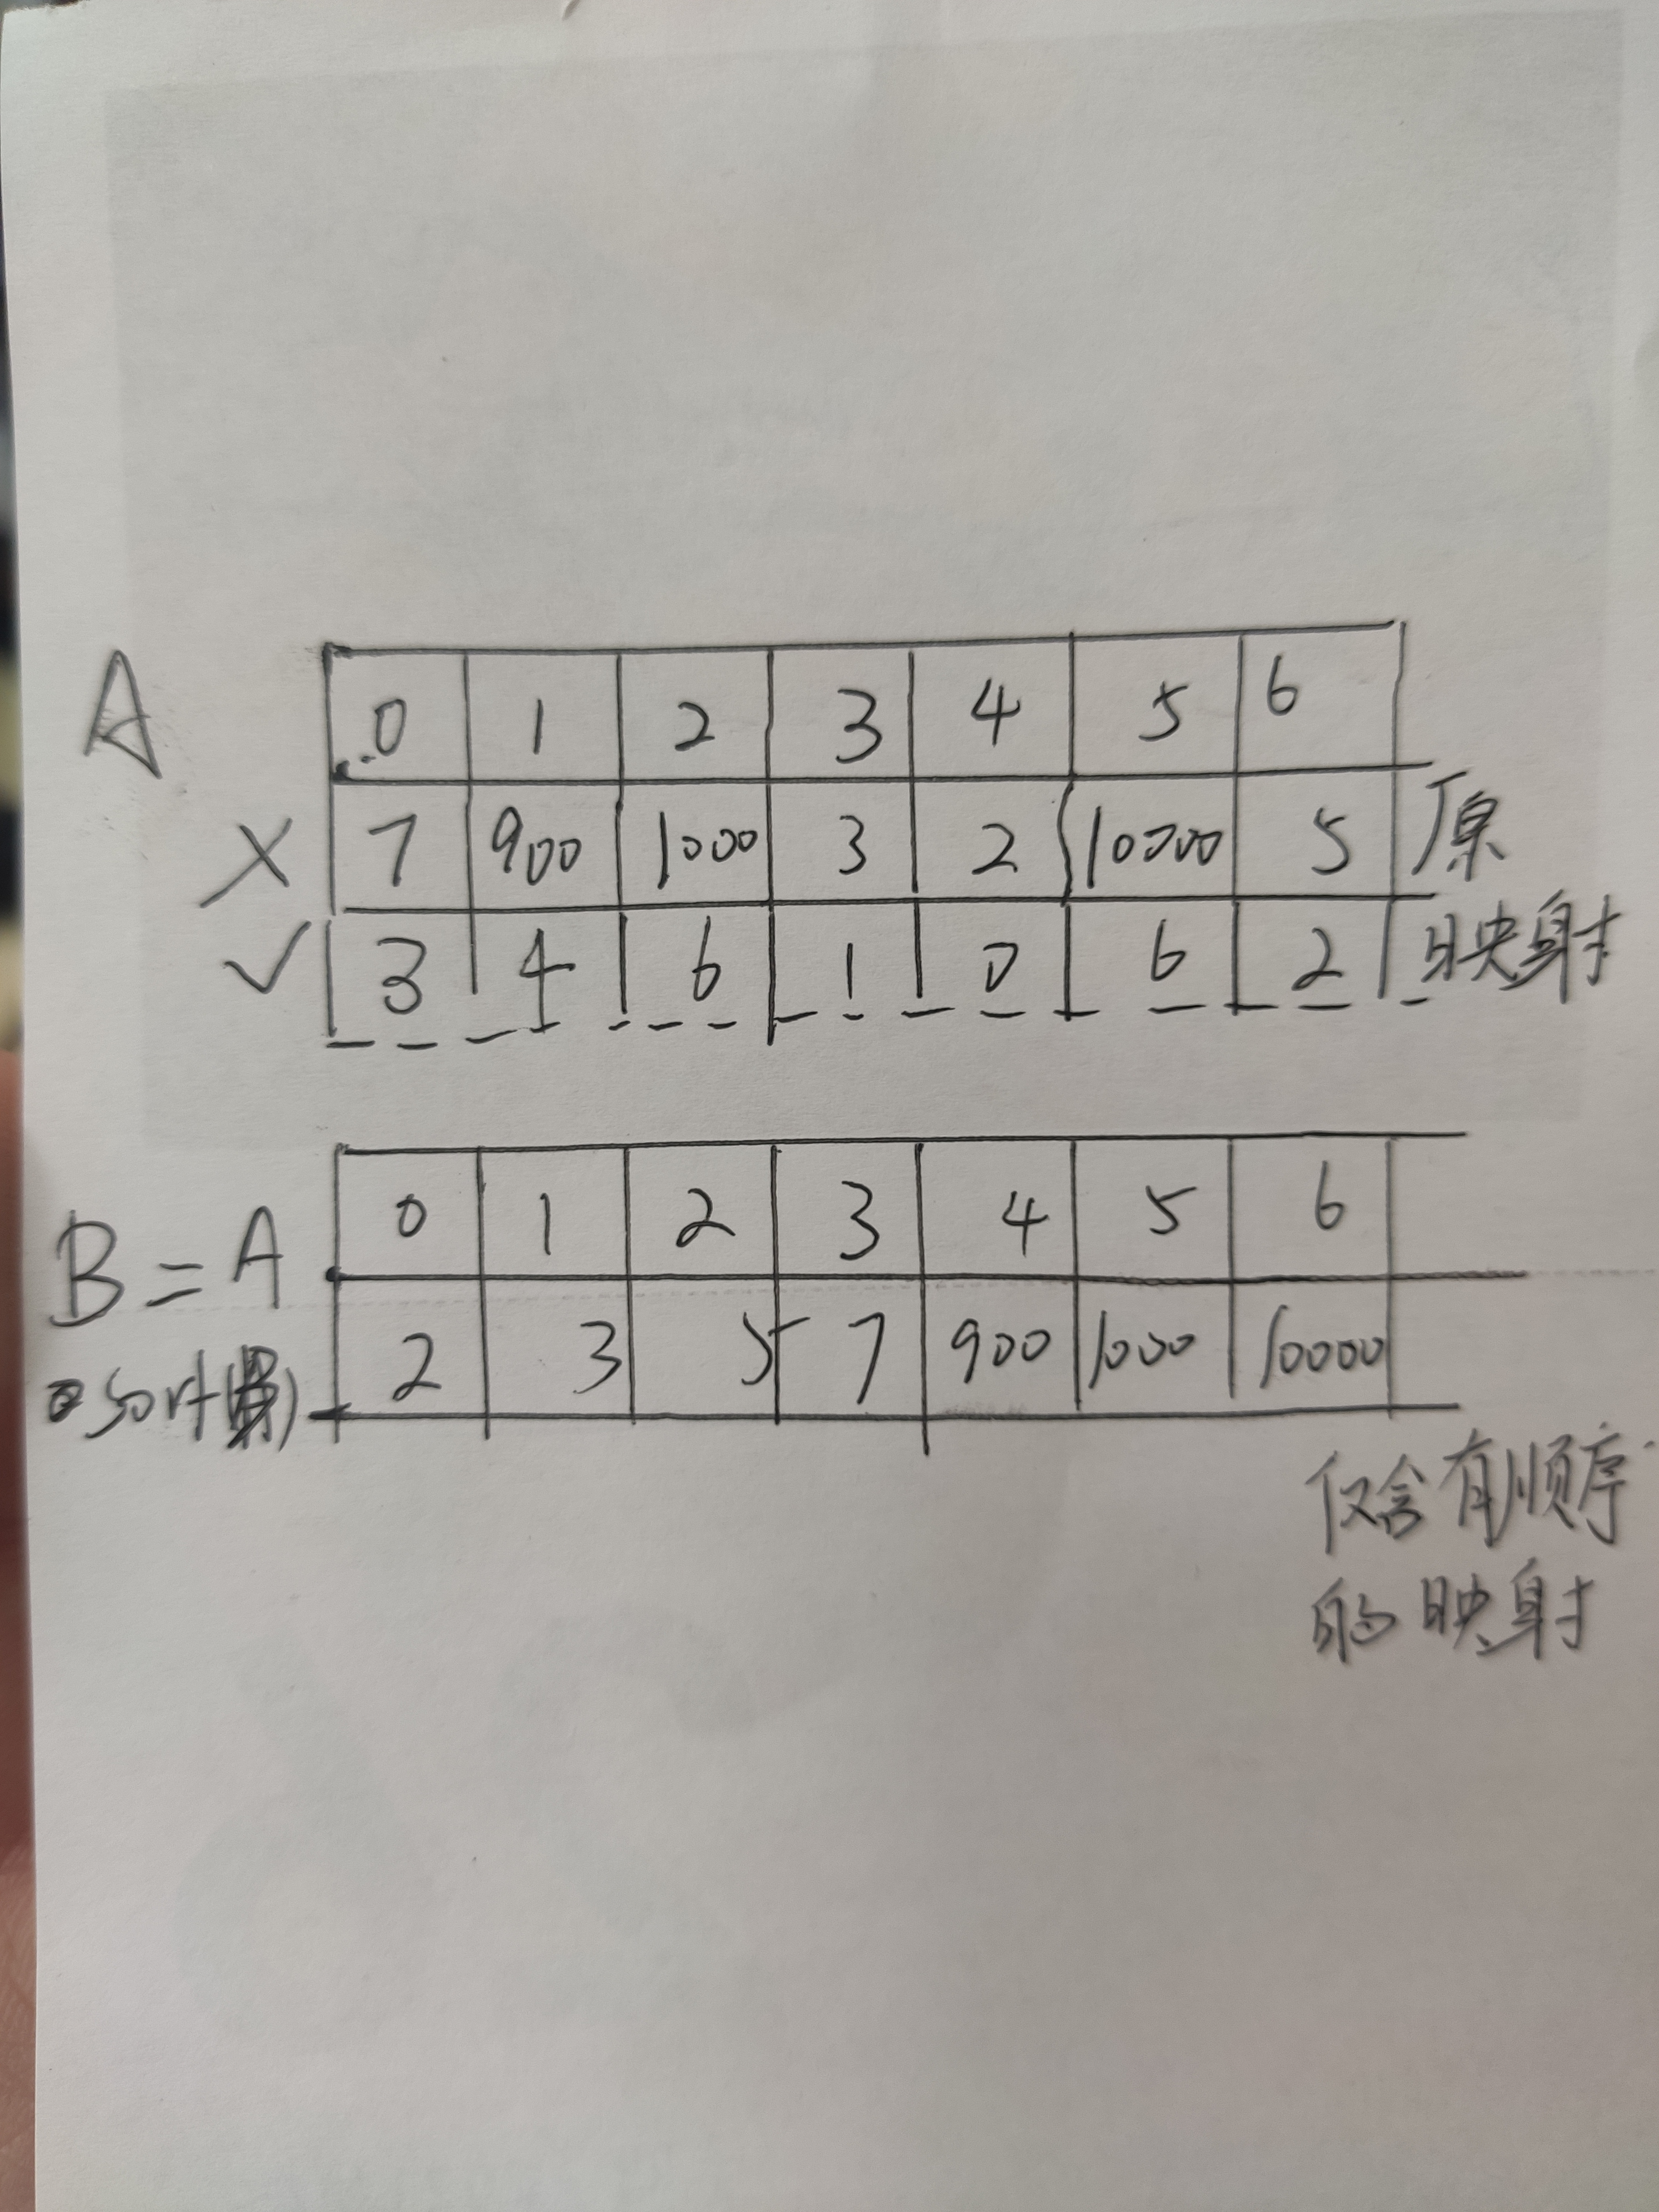
数组离散化1 问题描述 离散化一个序列的前提是我们只关心这个序列里面元素的相对大小,而不关心绝对大小(即只关心元素在序列中的排名);离散化的目的是让原来分布零散的值聚集到一起,减少空间浪费。那么如何获得元素排名呢,我们可以对原序列排序后去重,对于每一个$a_i$通过二分查找的方式计算排名作为离散化之后的值。当然这里也可以不去重,不影响排名。 数组本质上是一种有序的映射。i—-A—->x 即(A[i]=x)的映射。有时候为了建立值的数量与坐标i的反向映射,但此时值x的范围是离散化的。需要建立离散数组。一个的额外的映射数组,完成反向映射x—-B—->i。 2 离散数组——数组实现方法 使用数组B作为离散数组的映射。B的下标i能够反映原来数组中各个元素的大小顺序。但不是原来数组中各个元素的值。 建立离散数组的时间复杂度为O(nlog n)需要对原数组进行快速排序。 代码实现 12345678910vector<int> nums;//表示原来的数组vector<int> tmp = nums;//对离散数组进行排序sort(tmp.b...

2021-04-05
5.4 并查集
并查集 参考文献 https://zhuanlan.zhihu.com/p/93647900/ https://blog.csdn.net/qq_41754350/article/details/81271567 1 概念定义并查集被很多OIer认为是最简洁而优雅的数据结构之一,主要用于解决一些元素分组的问题。它管理一系列不相交的集合,并支持两种操作: 合并(Union):把两个不相交的集合合并为一个集合。 查询(Find):查询两个元素是否在同一个集合中。 2 并查集原理初始化 初始化所有的节点的根节点是自己。 假如有编号为1, 2, 3, …, n的n个元素,我们用一个数组fa[]来存储每个元素的父节点(因为每个元素有且只有一个父节点,所以这是可行的)。一开始,我们先将它们的父节点设为自己。 查询 我们用递归的写法实现对代表元素的查询:一层一层访问父节点,直至根节点(根节点的标志就是父节点是本身)。要判断两个元素是否属于同一个集合,只需要看它们的根节点是否相同即可。 合并 合并操作也是很简单的,先找到两个集合的代表元素,然后将前者的...
2021-03-26
3.1 单调栈-局部顺序
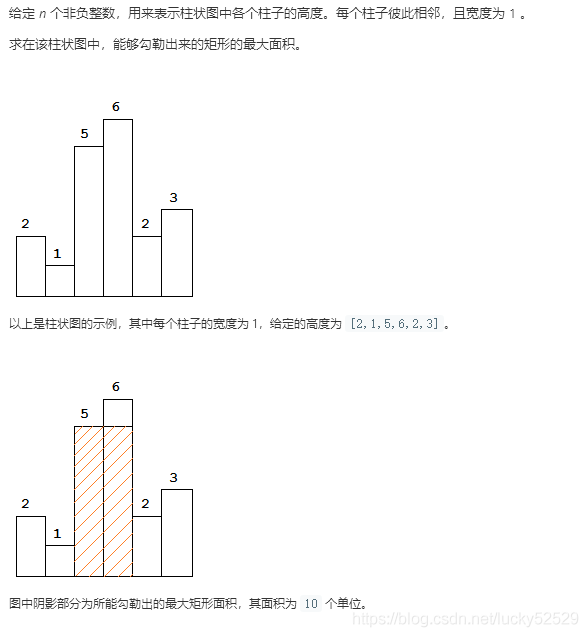
单调栈 用来解决局部顺序问题 柱形图问题多使用单调栈。 下边是对柱形图问题的总结。 视野总和:利用了栈内元素的数量计算问题。 柱形图中的最大矩形:利用的是出栈序列。这组序列构成了可能的最大矩形。 盛最多水的容器:利用了反向贪心思想。 接雨水问题:单调栈解法也是利用了出栈序列。这个序列的左右边界能够形成一个容器。双指针解法利用了反向贪心思想。 接雨水问题2 其它类型的单调栈 求最大区间:利用的出栈的序列。表示一个可能的最大值区间。 132模式:利用了其有序性。 1 视野总和问题描述 有n个人站队,所有的人全部向右看,个子高的可以看到个子低的发型,给出每个人的身高,问所有人能看到其他人发现总和是多少。 123输入:4 3 7 1输出:2解释:个子为4的可以看到个子为3的发型,个子为7可以看到个子为1的身高,所以1+1=2 问题分析 问题分类: 思路:观察题之后,我们发现实际上题目转化为找当前数字向右查找的第一个大于他的数字之间有多少个数字,然后将每个结果累计就是答案,但是这里时间复杂度为O(N^2),所以我们使用单调栈来解决这个问题。 策略选择 数据结构:单调栈 算...
2020-01-05
10.3 禁忌搜索算法
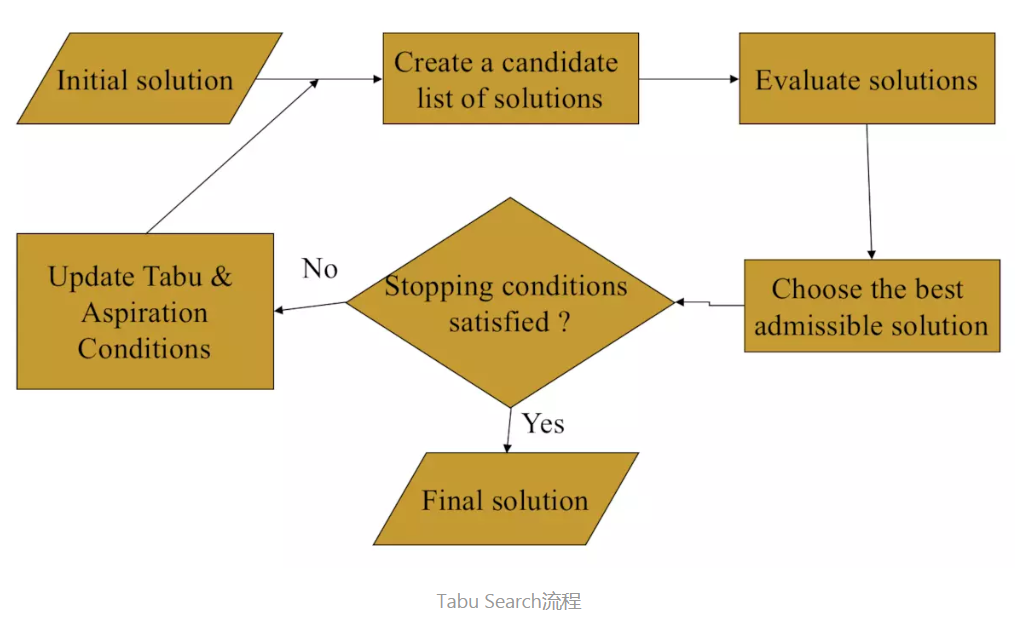
禁忌搜索算法1 算法说明算法概述 禁忌搜索(TS)是对局部邻域搜索的一种扩展,是一种全局优化算法。TS算法通过引入一个禁忌表和相应的禁忌准则来避免局部迂回,并通过“渴望准则”来挽救某些被禁忌的相对优化解,进而保证全局的有效搜索以实现全局优化。 标记对应已搜索到的局部最优解的一些对象,并在进一步的迭代搜索中尽量避开这些对象,但不是绝对禁止循环,从而保证对不同的有效搜索途径的探索。 基本思想 给定一个当前解(初始解)和一种邻域结构,在当前解的邻域中确定若干候选解; 若最佳候选解对应的目标植优于 “best so far” ,则忽视其禁忌特性,用其替代当前解和“best so far”值,并将相应的对象加入禁忌表,同时修改禁忌表中各对象的禁忌任期; 若不存在上述候选解,则选择在候选解中非禁忌的最佳状态为新的当前解,而无视它与当前解的优劣,同时将相应的对象加入禁忌表,并修改禁忌表中各对象的任期; 重复上述迭代搜索过程,直至满足停止条件。 算法原理邻域 对于组合优化问题,给定任意可行解x,x∈D,D是决策变量的定义域,对于D上的一个映射:N:x∈D→N(x)∈2(D) 其中2(D)...
2020-10-14
循环序列模型
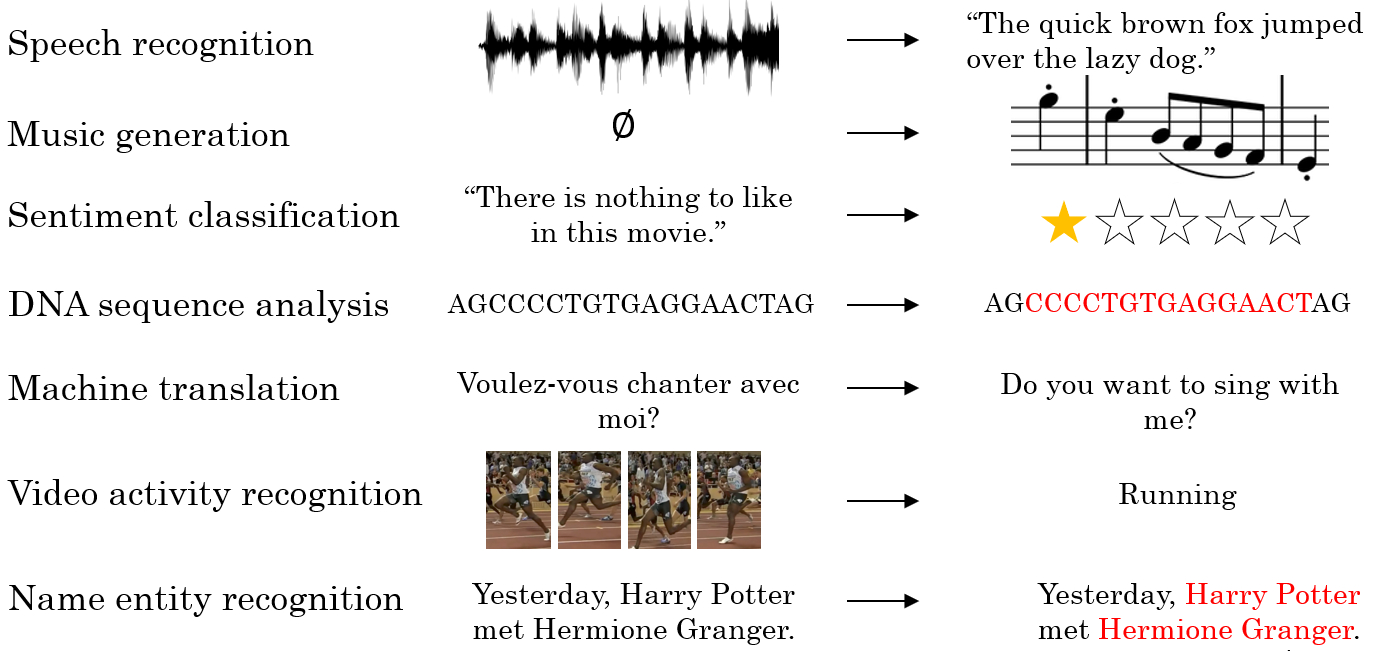
循环序列模型1 循环神经网络 自然语言和音频都是前后相互关联的数据,对于这些序列数据需要使用**循环神经网络(Recurrent Neural Network,RNN)**来进行处理。 使用 RNN 实现的应用包括下图中所示: 2 数学符号 对于一个序列数据 $x$,用符号 $x^{⟨t⟩}$来表示这个数据中的第 $t$个元素,用 $y^{⟨t⟩}$来表示第 $t$个标签,用 $T_x$ 和 $T_y$来表示输入和输出的长度。对于一段音频,元素可能是其中的几帧;对于一句话,元素可能是一到多个单词。 第 $i$ 个序列数据的第 $t$ 个元素用符号 $x^{(i)⟨t⟩}$,第 $t$ 个标签即为 $y^{(i)⟨t⟩}$。对应即有 $T^{(i)}_x$ 和 $T^{(i)}_y$。 one-hot 想要表示一个词语,需要先建立一个词汇表(Vocabulary),或者叫字典(Dictionary)。将需要表示的所有词语变为一个列向量,可以根据字母顺序排列,然后根据单词在向量中的位置,用 one-hot 向量(one-hot vector) 来表示该单词的标签:将每个...

2022-04-18
13 Dom
DOM 是 Document Object Model 的缩写,译为 文档对象模型。根据 W3C DOM 规范,DOM 是一种与浏览器、平台、语言无关的接口,使用该接口可以轻松地访问页面中所有的标准组件。 jQuery 中另一个重要的组成部分就是封装了原生 DOM 的操作。 基本操作html操作html() 方法用于读取或设置指定元素的 HTML 代码,类似于原生 DOM 中的 innerHTML 属性。 12345678//获取<p>元素的HTML代码$("input:eq(0)").click(function(){ alert( $("p").html() );});//设置<p>元素的HTML代码$("input:eq(1)").click(function(){ $("p").html("<strong>你最讨厌的水果是?</strong>");}); 文本操作text...


