
mandelbrot
阴影和增强标准化渲染
通过使用与幂归一化色图(gamma = 0.3)相关联的归一化重新计数,可以改善Mandelbrot集渲染。 由于阴影,渲染可以进一步增强。
maxiter给出了计算的精度。 在大多数现代笔记本电脑上,maxiter = 200应该需要几秒钟。

1 | import numpy as np |
Total running time of the script: ( 0 minutes 4.800 seconds)
下载这个示例
本博客所有文章除特别声明外,均采用 CC BY-NC-SA 4.0 许可协议。转载请注明来源 Estom的博客!
相关推荐

2020-09-26
bar_demo2
单位条形图使用各种厘米和英寸转换的图像。此示例显示默认单位内省如何工作(ax1),如何使用各种关键字来设置x和y单位以覆盖默认值(ax2,ax3,ax4)以及如何使用标量设置xlimits(ax3,当前单位) 假设)或单位(用于将数字转换为当前单位的转换)。 此示例需要 basic_units.py 12345678910111213141516171819202122import numpy as npfrom basic_units import cm, inchimport matplotlib.pyplot as pltcms = cm * np.arange(0, 10, 2)bottom = 0 * cmwidth = 0.8 * cmfig, axs = plt.subplots(2, 2)axs[0, 0].bar(cms, cms, bottom=bottom)axs[0, 1].bar(cms, cms, bottom=bottom, width=width, xunits=cm, yunits=inch)axs[1, 0].bar(cms, cms, bo...

2022-12-05
18.关系型数据和文档型数据库有什么区别?
关系型数据和文档型数据库有什么区别?关系数据库(Relational Database)是建立在关系模型基础上的数据库,借助于几何代数等数学概念和方法来处理数据库中的数据。所谓关系模型是一对一、一对多或者多对多等关系,常见的关系型数据库有 Oracle、SQL Server、DB2、MySQL 等。 而文档型数据库是一种非关系型数据库,非关系型数据库(Not Only SQL,NoSQL)正好与关系型数据库相反,它不是建立在“关系模型”上的数据库。文档型数据库的典型代表是 MongoDB。 我们本课时的面试题是,关系型数据库和文档型数据库有什么区别? 典型回答关系型数据库属于早期的传统型数据库,它有着标准化的数据模型,以及事务和持久化的支持、例如,关系型数据库都会支持的 ACID 特性,也就是原子性(Atomicity)、一致性(Consistency)、隔离性(Isolation)和持久性(Durability),具体含义如下。 原子性(Atomicity):是指一个事务中的所有操作,要么全部完成、要么全部不完成,不会存在中间的状态。也就是说事务在正常的情况下会执行完成;异常...

2022-04-18
16 选择器
什么是 jQuery 的选择器jQuery 的选择器的想法是源于 CSS 中的选择器的用法,其实在 JavaScript 中也有类似的用法,比如 querySelector() 或 querySelectorAll() 方法的使用,也是借助 CSS 中的选择器来定位 HTML 页面元素的。只不过相比 jQuery 中的选择器,JavaScript 中的 querySelector() 或 querySelectorAll() 方法的性能相对差一些而已。 jQuery 的选择器最主要的作用就是用于定位 HTML 页面的元素。它不仅可以定位 HTML 页面中具体某个元素,还可以通过各种方式定位复合条件的一组元素等等。 值得注意的是: jQuery 的选择器最大的特点就是将定位元素和元素行为进行了有效的分离。这是在实际开发中非常必要的一项特点! jQuery 选择器的种类jQuery 中使用其工厂函数 $() 作为容器,来接收 jQuery 的选择器内容。而 jQuery 的选择器则以字符串形式传递给 jQuery 的工厂函数。 jQuery 的选择器种类大概可以分为以下几种: 基...
2025-08-12
02 技巧原则
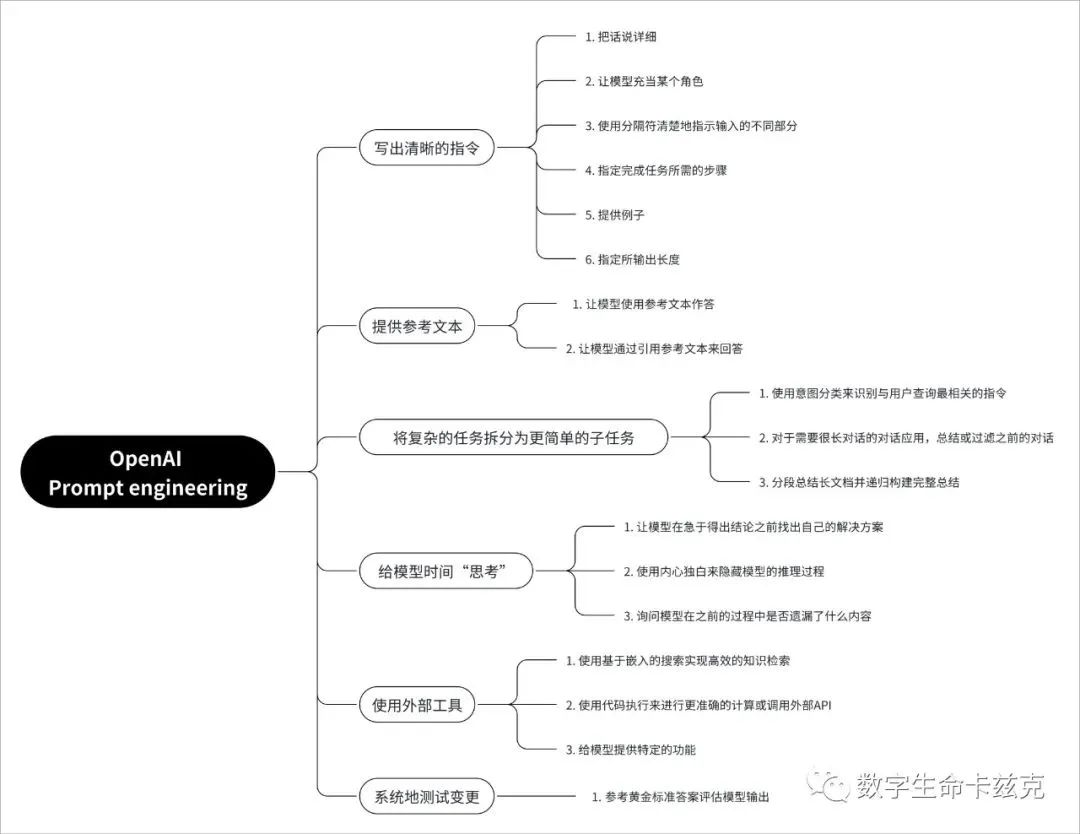
参考文献https://hub.baai.ac.cn/view/33671https://prompt-guide.xiniushu.com/https://prompt-engineering.xiniushu.com/guides/conclusion 1、 提示词的六大原则 Write clear instructions(写出清晰的指令) Provide reference text(提供参考文本) Split complex tasks into simpler subtasks(将复杂的任务拆分为更简单的子任务) Give the model time to “think”(给模型时间「思考」) Use external tools(使用外部工具) Test changes systematically(系统地测试变更) 1. 写出清晰的指令这个其实就是我天天说的,任何 Prompt 技巧都不如清晰的表达你的需求,这就像人与人沟通一样,话都说不明白,怎么能让对面理解你呢?一味的靠抄 Prompt 模板,其实不是长久之计。所以,写出清晰的指令,是核心中的核心...
2024-05-13
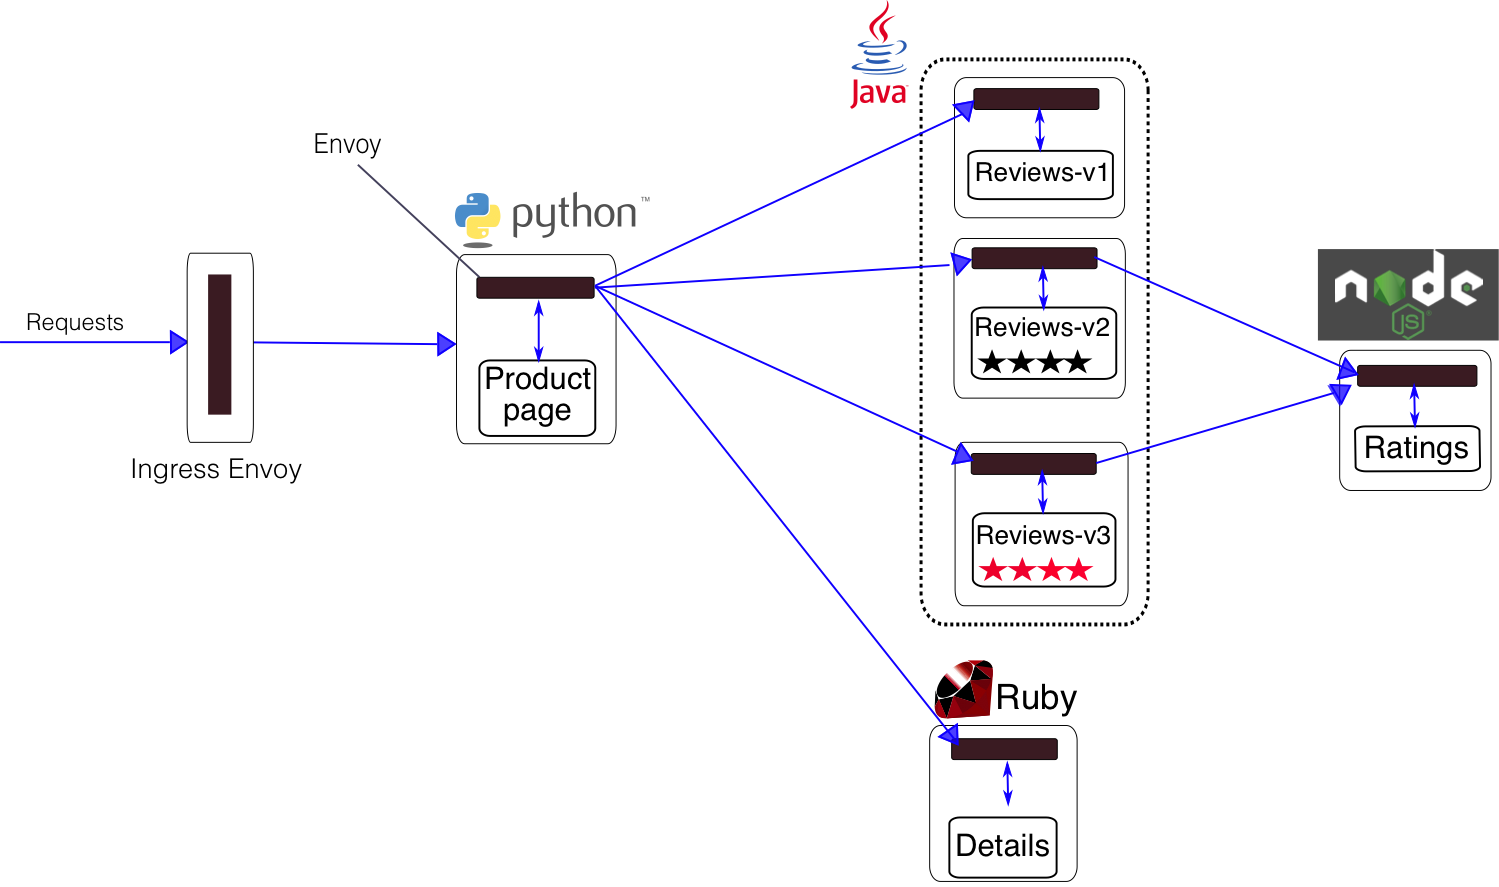
03 Istio注入原理
规范Pod Spec 中需满足的条件为了成为 服务网格中的一部分,Kubernetes 集群中的每个 Pod 都必须满足如下条件,这些规范不是由 Istio 自动注入的,而需要 生成 Kubernetes 应用部署的 YAML 文件时需要遵守的: Service 关联:每个 pod 都必须只属于某一个 Kubernetes Service (当前不支持一个 pod 同时属于多个 service)。命名的端口:Service 的端口必须命名。端口的名字必须遵循如下格式 <protocol>[-<suffix>],可以是 http、http2、 grpc、 mongo、 或者 redis 作为 <protocol> ,这样才能使用 Istio 的路由功能。例如 name: http2-foo 和 name: http 都是有效的端口名称,而 name: http2foo 不是。如果端口的名称是不可识别的前缀或者未命名,那么该端口上的流量就会作为普通的 TCP 流量来处理(除非使用 Protocol: UDP 明确声明使用 UDP 端口)。带有 ap...

2021-12-24
pv
pv显示当前在命令行执行的命令的进度信息,管道查看器 补充说明pv命令 Pipe Viewer 的简称,由Andrew Wood 开发。意思是通过管道显示数据处理进度的信息。这些信息包括已经耗费的时间,完成的百分比(通过进度条显示),当前的速度,全部传输的数据,以及估计剩余的时间。 下载安装12345# Debian 系的操作系统,如 Ubuntusudo apt-get install pv# RedHat系的则这样:yum install pv 语法12pv(选项)(参数)pv [OPTION] [FILE]... 选项123456789101112131415161718192021222324252627282930313233343536373839-p, --progress 显示进度条-t, --timer 显示已用时间-e, --eta 显示预计到达时间 (完成)-I, --fineta 显示绝对估计到达时间 (...


