
topographic_hillshading
地形山体阴影
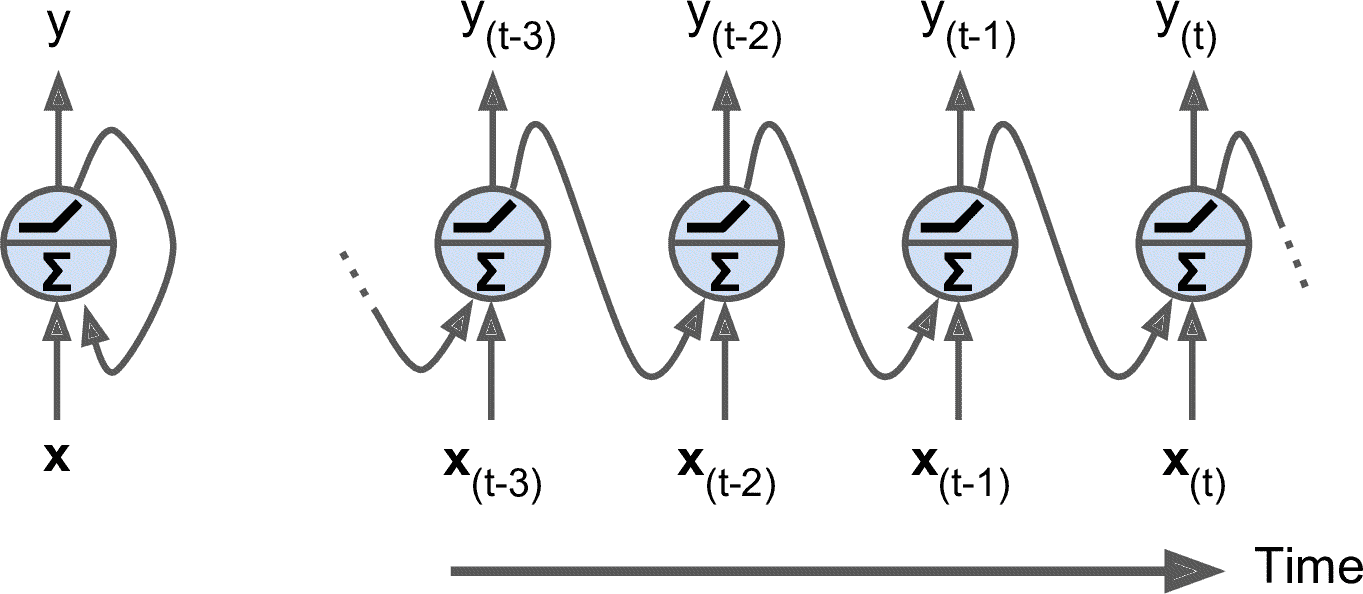
在“山体阴影”图上展示不同混合模式和垂直夸大的视觉效果。
请注意,“叠加”和“柔和”混合模式适用于复杂曲面,例如此示例,而默认的“hsv”混合模式最适用于光滑曲面,例如许多数学函数。
在大多数情况下,山体阴影纯粹用于视觉目的,可以安全地忽略dx / dy。 在这种情况下,您可以通过反复试验调整vert_exag(垂直夸大)以获得所需的视觉效果。 但是,此示例演示了如何使用dx和dy kwargs来确保vert_exag参数是真正的垂直夸大。

1 | import numpy as np |
下载这个示例
本博客所有文章除特别声明外,均采用 CC BY-NC-SA 4.0 许可协议。转载请注明来源 Estom的博客!
相关推荐

2020-09-26
color_cycle_default
默认属性循环中的颜色显示默认prop_cycle中的颜色,该颜色是从rc参数中获取的。 123456789101112131415161718192021222324252627282930313233import numpy as npimport matplotlib.pyplot as pltprop_cycle = plt.rcParams['axes.prop_cycle']colors = prop_cycle.by_key()['color']lwbase = plt.rcParams['lines.linewidth']thin = lwbase / 2thick = lwbase * 3fig, axs = plt.subplots(nrows=2, ncols=2, sharex=True, sharey=True)for icol in range(2): if icol == 0: lwx, lwy = thin, lwbase else: lwx, lwy...
2021-03-20
15
十五、使用 RNN 和 CNN 处理序列 译者:@SeanCheney 击球手击出垒球,外场手会立即开始奔跑,并预测球的轨迹。外场手追踪球,不断调整移动步伐,最终在观众的掌声中抓到它。无论是在听完朋友的话还是早餐时预测咖啡的味道,你时刻在做的事就是在预测未来。在本章中,我们将讨论循环神经网络,一类可以预测未来的网络(当然,是到某一点为止)。它们可以分析时间序列数据,比如股票价格,并告诉你什么时候买入和卖出。在自动驾驶系统中,他们可以预测行车轨迹,避免发生事故。更一般地说,它们可在任意长度的序列上工作,而不是截止目前我们讨论的只能在固定长度的输入上工作的网络。举个例子,它们可以将语句,文件,以及语音范本作为输入,应用在在自动翻译,语音到文本的自然语言处理应用中。 在本章中,我们将学习循环神经网络的基本概念,如何使用时间反向传播训练网络,然后用来预测时间序列。然后,会讨论 RNN 面对的两大难点: 不稳定梯度(换句话说,在第 11 章中讨论的梯度消失/爆炸),可以使用多种方法缓解,包括循环丢弃和循环层归一化。 有限的短期记忆,可以通过 LSTM 和 GRU 单元延长。...

2020-09-26
donut
绘制甜甜圈Draw donuts (miam!) using Paths and PathPatches. This example shows the effect of the path’s orientations in a compound path. 123456789101112131415161718192021222324252627282930313233343536373839404142434445464748495051525354import numpy as npimport matplotlib.path as mpathimport matplotlib.patches as mpatchesimport matplotlib.pyplot as pltdef wise(v): if v == 1: return "CCW" else: return "CW"def make_circle(r): t = np.arange(0, np.pi * 2.0, 0.0...

2020-09-26
contourf_demo
Contourf演示如何使用 axes.Axes.contourf() 方法创建填充的等高线图。 123456789101112131415161718192021222324252627282930313233343536373839404142434445464748495051525354555657585960616263646566676869707172737475767778798081828384858687888990919293949596979899import numpy as npimport matplotlib.pyplot as pltorigin = 'lower'delta = 0.025x = y = np.arange(-3.0, 3.01, delta)X, Y = np.meshgrid(x, y)Z1 = np.exp(-X**2 - Y**2)Z2 = np.exp(-(X - 1)**2 - (Y - 1)**2)Z = (Z1 - Z2) * 2nr, nc = Z.shape# put NaNs in on...

2020-09-23
2.6数据类型转换
数据类型转换 原文: https://thepythonguru.com/datatype-conversion/ 于 2020 年 1 月 7 日更新 偶尔,您会希望将一种类型的数据类型转换为另一种类型。 数据类型转换也称为类型转换。 将int转换为float 要将int转换为float,可以使用float()函数。 1234>>> i = 10>>> float(i)10.0 将float转换为int 要将float转换为int,您需要使用int()函数。 1234>>> f = 14.66>>> int(f)14 将字符串转换为int 要将string转换为int,请使用int()函数。 1234>>> s = "123">>> int(s)123 提示: 如果字符串包含非数字字符,则int()将引发ValueError异常。 将数字转换为字符串 要将数字转换为字符串,请使用str()函数。 1234567>>> i ...
2021-04-11
5 简化条件表达式
5 简化条件表达式1 Decompose Conditional(分解条件表达式)复杂的条件逻辑会降低代码的可读性,通过从if/else if/else三个段落中分别提炼出独立的函数,根据每一段落的用途命名函数,从而更清晰地表达自己的意图。 重构示例13123456// 重构前if (date.Before(SUMMER_START) || date.After(SUMMER_END)) { charge = quantity * m_winterRate + m_winterServiceCharge;} else { charge = quantity * m_summerRate;} 123456789101112131415161718192021// 重构后if (NotSummer(date)) { charge = WinterCharge(quantity);} else { charge = SummerCharge(quantity);}...


