
boxplot
箱形图中的艺术
此示例演示如何使用各种kwargs完全自定义箱形图。第一个图演示了如何删除和添加单个组件(请注意,平均值是默认情况下未显示的唯一值)。第二个图展示了如何定制艺术家的风格。它还演示了如何将胡须的极限设置为特定的百分位数(右下轴)
关于箱形图及其历史的一般参考可以在这里找到:http://vita.had.co.nz/papers/boxplots.pdf
1 | import numpy as np |
演示如何切换不同元素的显示:
1 | fig, axes = plt.subplots(nrows=2, ncols=3, figsize=(6, 6), sharey=True) |

演示如何自定义显示不同的元素:
1 | boxprops = dict(linestyle='--', linewidth=3, color='darkgoldenrod') |

下载这个示例
本博客所有文章除特别声明外,均采用 CC BY-NC-SA 4.0 许可协议。转载请注明来源 Estom的博客!
相关推荐

2021-06-03
5 活动图
0 活动图实例12345678910111213141516171819202122232425262728293031323334353637383940414243444546474849505152@startumltitle Servlet Container(*) --> "ClickServlet.handleRequest()"--> "new Page"if "Page.onSecurityCheck" then ->[true] "Page.onInit()" if "isForward?" then ->[no] "Process controls" if "continue processing?" then -->[yes] ===RENDERING=== else -->[no] ===REDIRECT_CHECK=== endif else ...
2022-12-04
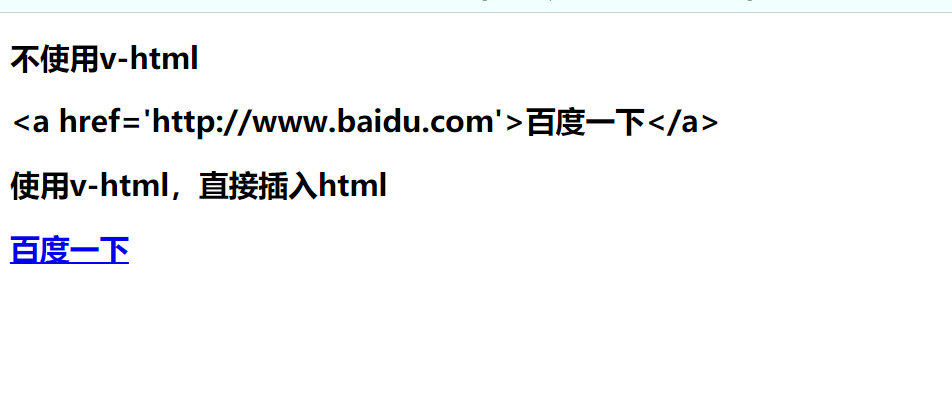
03-插值操作
# 1. Mustache语法 mustache是胡须的意思,因为`{{}}`像胡须,又叫大括号语法。 在vue对象挂载的dom元素中,`{{}}`不仅可以直接写变量,还可以写简单表达式。 12345678910111213141516171819202122232425262728293031323334<!DOCTYPE html><html lang="en"><head> <meta charset="UTF-8"> <meta name="viewport" content="width=device-width, initial-scale=1.0"> <meta http-equiv="X-UA-Compatible" content="ie=edge"> <title...

2021-12-24
firewall-cmd
firewall-cmdLinux上新用的防火墙软件,跟iptables差不多的工具 补充说明firewall-cmd 是 firewalld的字符界面管理工具,firewalld是centos7的一大特性,最大的好处有两个:支持动态更新,不用重启服务;第二个就是加入了防火墙的“zone”概念。 firewalld跟iptables比起来至少有两大好处: firewalld可以动态修改单条规则,而不需要像iptables那样,在修改了规则后必须得全部刷新才可以生效。 firewalld在使用上要比iptables人性化很多,即使不明白“五张表五条链”而且对TCP/IP协议也不理解也可以实现大部分功能。 firewalld自身并不具备防火墙的功能,而是和iptables一样需要通过内核的netfilter来实现,也就是说firewalld和 iptables一样,他们的作用都是用于维护规则,而真正使用规则干活的是内核的netfilter,只不过firewalld和iptables的结 构以及使用方法不一样罢了。 命令格式 1firewall-cmd [选项 ... ...
2021-03-20
23
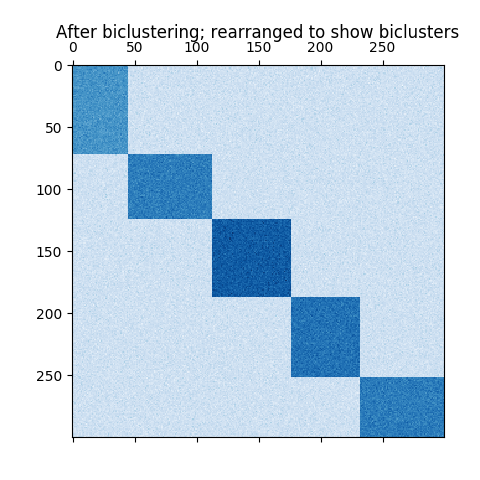
2.4. 双聚类校验者: @udy @barrycg翻译者: @程威 Biclustering(双向聚类) 的实现模块是 sklearn.cluster.bicluster。 双向聚类算法对数据矩阵的行列同时进行聚类。而这些行列的聚类称之为 双向簇(biclusters)。每一次聚类都会基于原始数据矩阵确定一个子矩阵, 并且这些子矩阵具有一些需要的属性。 例如, 给定一个矩阵 (10, 10) , 如果对其中三行二列进行双向聚类,就可以获得一个子矩阵 (3, 2)。 123456789>>> import numpy as np>>> data = np.arange(100).reshape(10, 10)>>> rows = np.array([0, 2, 3])[:, np.newaxis]>>> columns = np.array([1, 2])>>> data[rows, columns]array([[ 1, 2], [21, 22]...

2020-07-08
2XML配置
mybatis-configuration.xml 设置名 描述 有效值 默认值 cacheEnabled 全局性地开启或关闭所有映射器配置文件中已配置的任何缓存 true false lazyLoadingEnabled 延迟加载的全局开关。当开启时,所有关联对象都会延迟加载。特定关联关系中可通过设置fetchType属性来覆盖该项的开关状态 true false aggressiveLazyLoading 开启时,任一方法的调用都会加载该对象的所有延迟加载属性。否则,每个延迟加载属性会按需加载 true false multipleResultSetsEnabled 是否允许单个语句返回多结果集(需要数据库驱动支持) true false useColumnLabel 使用列标签代替列明。实际表现依赖于数据库驱动,具体可参考数据库驱动的相关文档,或通过对比测试来观察 true false useGeneratedKeys 允许JDBC支持自动生成主键,需要数据库驱动支持。如果设置为true,将强制使用自动生成主键。...
2019-10-24
IPv6-NS
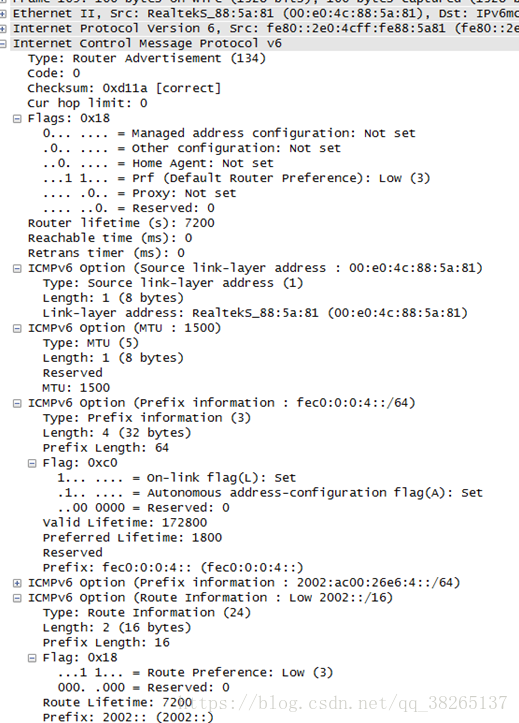
邻居发现协议NDP 参考文献 邻居发现协议 0 NDP简介邻居发现协议NDP(Neighbor Discovery Protocol)是IPv6协议体系中一个重要的基础协议。邻居发现协议替代了IPv4的ARP(Address Resolution Protocol)和ICMP路由器发现(Router Discovery),它定义了使用ICMPv6报文实现。 地址自动配置 路由器和路由前缀发现 地址解析 跟踪邻居状态(邻居不可达检测) 重复地址检测 重定向 1 地址自动配置IPv4使用DHCP实现自动配置,包括IP地址,缺省网关等信息,简化了网络管理。IPv6地址增长为128位,且终端节点多,对于自动配置的要求更为迫切,除保留了DHCP作为有状态自动配置外,还增加了无状态自动配置。无状态自动配置即自动生成链路本地地址,主机根据RA报文的前缀信息,自动配置全球单播地址等,并获得其他相关信息。 IPv6主机无状态自动配置过程: 根据接口标识产生链路本地地址。 发出邻居请求,进行重复地址检测。 如地址冲突,则停止自动配置,需要手工配置。 如不冲突,链路本地地址生效,节点具备本...


