
customized_violin
自定义小提琴图
此示例演示如何完全自定义小提琴图。 第一个图通过仅提供数据来显示默认样式。第二个图首先限制了matplotlib用额外的kwargs绘制的内容。然后在顶部绘制箱形图的简化表示。 最后,修改了小提琴图的风格。
有关小提琴图的更多信息,scikit-learn文档有一个很棒的部分:http://scikit-learn.org/stable/modules/density.html

1 | import matplotlib.pyplot as plt |
下载这个示例
本博客所有文章除特别声明外,均采用 CC BY-NC-SA 4.0 许可协议。转载请注明来源 Estom的博客!
相关推荐

2020-09-26
font_family_rc_sgskip
配置字体系列你可以明确地设置为给定字体样式拾取的字体系列(例如,‘serif’、‘sans-serif’或‘monSpace’)。 在下面的示例中,我们只允许一个字体系列(Tahoma)用于sans-serif字体样式。你是font.family rc param的默认系列,例如: 1rcParams['font.family'] = 'sans-serif' 并为font.family设置一个字体样式列表,以尝试按顺序查找: 12rcParams['font.sans-serif'] = ['Tahoma', 'DejaVu Sans', 'Lucida Grande', 'Verdana'] 12345678910from matplotlib import rcParamsrcParams['font.family'] = 'sans-seri...

2020-09-26
dfrac_demo
\dfrac 和 \frac之间的区别在此示例中,说明了 \dfrac和\frac TeX宏之间的差异; 特别是,使用Mathtex时显示样式和文本样式分数之间的差异。 New in version 2.1. 注意:要将 \dfrac与LaTeX引擎一起使用(text.usetex:True),您需要使用text.latex.preamble rc导入amsmath包,这是一个不受支持的功能; 因此,在 \frac宏之前使用 \displaystyle选项来获取LaTeX引擎的这种行为可能是个更好的主意。 12345678import matplotlib.pyplot as pltfig = plt.figure(figsize=(5.25, 0.75))fig.text(0.5, 0.3, r'\dfrac: $\dfrac{a}{b}$', horizontalalignment='center', verticalalignment='center')fi...

2021-12-24
pgrep
pgrep根据用户给出的信息在当前运行进程中查找并列出符合条件的进程ID(PID) 补充说明pgrep命令 以名称为依据从运行进程队列中查找进程,并显示查找到的进程id。每一个进程ID以一个十进制数表示,通过一个分割字符串和下一个ID分开,默认的分割字符串是一个新行。对于每个属性选项,用户可以在命令行上指定一个以逗号分割的可能值的集合。 语法1pgrep(选项)(参数) 选项1234567-o:仅显示找到的最小(起始)进程号;-n:仅显示找到的最大(结束)进程号;-l:显示进程名称;-P:指定父进程号;-g:指定进程组;-t:指定开启进程的终端;-u:指定进程的有效用户ID。 参数进程名称:指定要查找的进程名称,同时也支持类似grep指令中的匹配模式。 实例1234567891011121314151617181920212223pgrep -lo httpd4557 httpd [root@localhost ~]# pgrep -ln httpd4566 httpd[root@localhost ~]# pgrep -l httpd4557 httpd4560 httpd...
2023-11-09
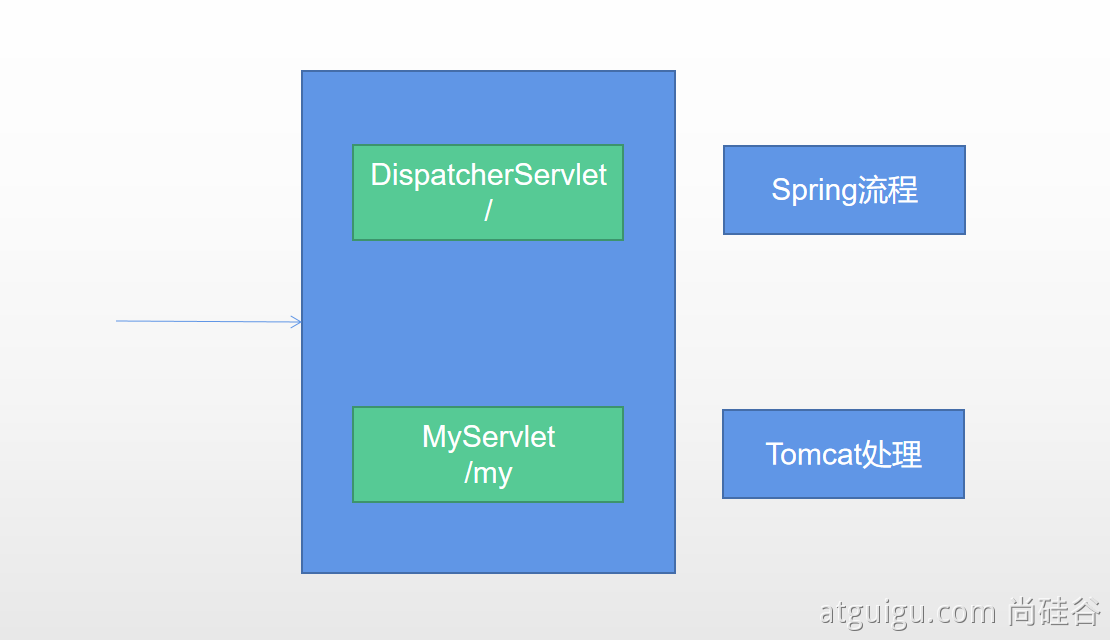
06 Web开发5-原生组件
0 概述使用的标准方法 1234@ServletComponentScan(basePackages = "com.atguigu.admin") :指定原生Servlet组件都放在那里@WebServlet(urlPatterns = "/my"):效果:直接响应,没有经过Spring的拦截器?@WebFilter(urlPatterns={"/css/*","/images/*"})@WebListener WebServlet1234567891011@WebServlet(urlPatterns = "/path2/*")public class MyServlet extends HttpServlet { @Override protected void doGet (HttpServletRequest req, HttpServletResponse resp) throws ServletException...

2020-07-08
2XML配置
mybatis-configuration.xml 设置名 描述 有效值 默认值 cacheEnabled 全局性地开启或关闭所有映射器配置文件中已配置的任何缓存 true false lazyLoadingEnabled 延迟加载的全局开关。当开启时,所有关联对象都会延迟加载。特定关联关系中可通过设置fetchType属性来覆盖该项的开关状态 true false aggressiveLazyLoading 开启时,任一方法的调用都会加载该对象的所有延迟加载属性。否则,每个延迟加载属性会按需加载 true false multipleResultSetsEnabled 是否允许单个语句返回多结果集(需要数据库驱动支持) true false useColumnLabel 使用列标签代替列明。实际表现依赖于数据库驱动,具体可参考数据库驱动的相关文档,或通过对比测试来观察 true false useGeneratedKeys 允许JDBC支持自动生成主键,需要数据库驱动支持。如果设置为true,将强制使用自动生成主键。...

2022-04-18
10 块级元素
大多数 HTML 元素被定义为块级元素或内联元素。 10. 块级元素块级元素在浏览器显示时,通常会以新行来开始(和结束)。 我们已经学习过的块级元素有: <h1>, <p>, <ul>, <table> 等。 值得注意的是: <p> 标签中不能包含任何块级元素。 <div> 元素<div> 元素是块级元素,它可用于组合其他 HTML 元素的容器。 <div> 元素没有特定的含义。除此之外,由于它属于块级元素,浏览器会在其前后显示折行。 如果与 CSS 一同使用,<div> 元素可用于对大的内容块设置样式属性。 <div> 元素的另一个常见的用途是文档布局。 值得注意的是: <div> 取代了使用表格定义布局的老式方法。 内联元素内联元素在显示时通常不会以新行开始。 我们已经学习过的内联元素有: <td>, <a>, <img> 等。 值得注意的是: <a> 标签中不能包含 <a> ...


