
errorbar_limits
误差条形图中的上限和下限
在matplotlib中,误差条可以有“限制”。对误差线应用限制实质上使误差单向。因此,可以分别通过uplims,lolims,xuplims和xlolims参数在y方向和x方向上应用上限和下限。 这些参数可以是标量或布尔数组。
例如,如果xlolims为True,则x-error条形将仅从数据扩展到递增值。如果uplims是一个填充了False的数组,除了第4和第7个值之外,所有y误差条都是双向的,除了第4和第7个条形,它们将从数据延伸到减小的y值。

1 | import numpy as np |
下载这个示例
本博客所有文章除特别声明外,均采用 CC BY-NC-SA 4.0 许可协议。转载请注明来源 Estom的博客!
相关推荐

2021-12-24
mapfile
mapfile从标准输入读取行并赋值到数组。 概要1mapfile [-d delim] [-n count] [-O origin] [-s count] [-t] [-u fd] [-C callback] [-c quantum] [array] 主要用途 从标准输入或文件描述符读取行并赋值到数组。 选项123456789101112-d delim 将delim设为行分隔符,代替默认的换行符。-n count 从标准输入中获取最多count行,如果count为零那么获取全部。-O origin 从数组下标为origin的位置开始赋值,默认的下标为0。-s count 跳过对前count行的读取。-t 读取时移除行分隔符delim(默认为换行符)。-u fd 从文件描述符fd中读取。-C callback 每当读取了quantum行时,调用callback语句。-c quantum 设定读取的行数为quantum。如果使用-C时没有同时使用-c指定quantum的值,那...
2021-10-09
huawei
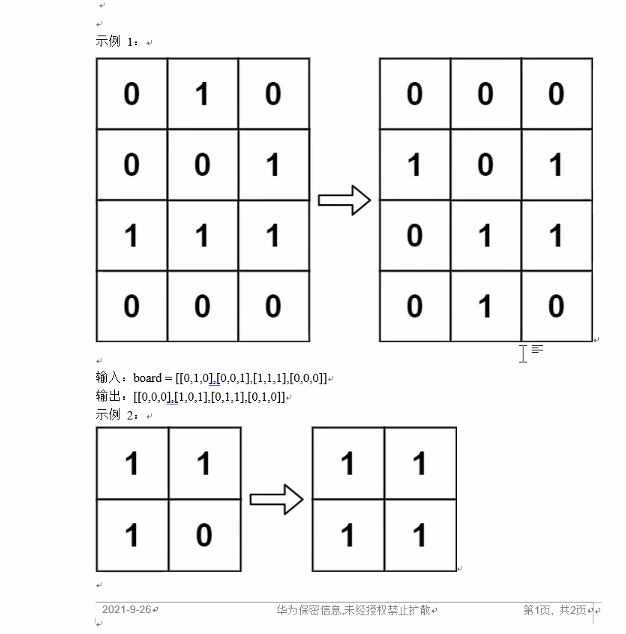
给定一个包含 m × n 个格子的面板,每一个格子都可以看成是一个细胞。每个细胞都具有一个初始状态:1 即为活细胞(live),或 0 即为死细胞(dead)。每个细胞与其八个相邻位置(水平,垂直,对角线)的细胞都遵循以下四条生存定律: 如果活细胞周围八个位置的活细胞数少于两个,则该位置活细胞死亡;如果活细胞周围八个位置有两个或三个活细胞,则该位置活细胞仍然存活;如果活细胞周围八个位置有超过三个活细胞,则该位置活细胞死亡;如果死细胞周围正好有三个活细胞,则该位置死细胞复活;下一个状态是通过将上述规则同时应用于当前状态下的每个细胞所形成的,其中细胞的出生和死亡是同时发生的。给你 m x n 网格面板 board 的当前状态,返回下一个状态。 示例 1: 输入:board = [[0,1,0],[0,0,1],[1,1,1],[0,0,0]]输出:[[0,0,0],[1,0,1],[0,1,1],[0,1,0]]示例 2: 输入:board = [[1,1],[1,0]]输出:[[1,1],[1,1]] 提示: m == board.leng...
2021-05-09
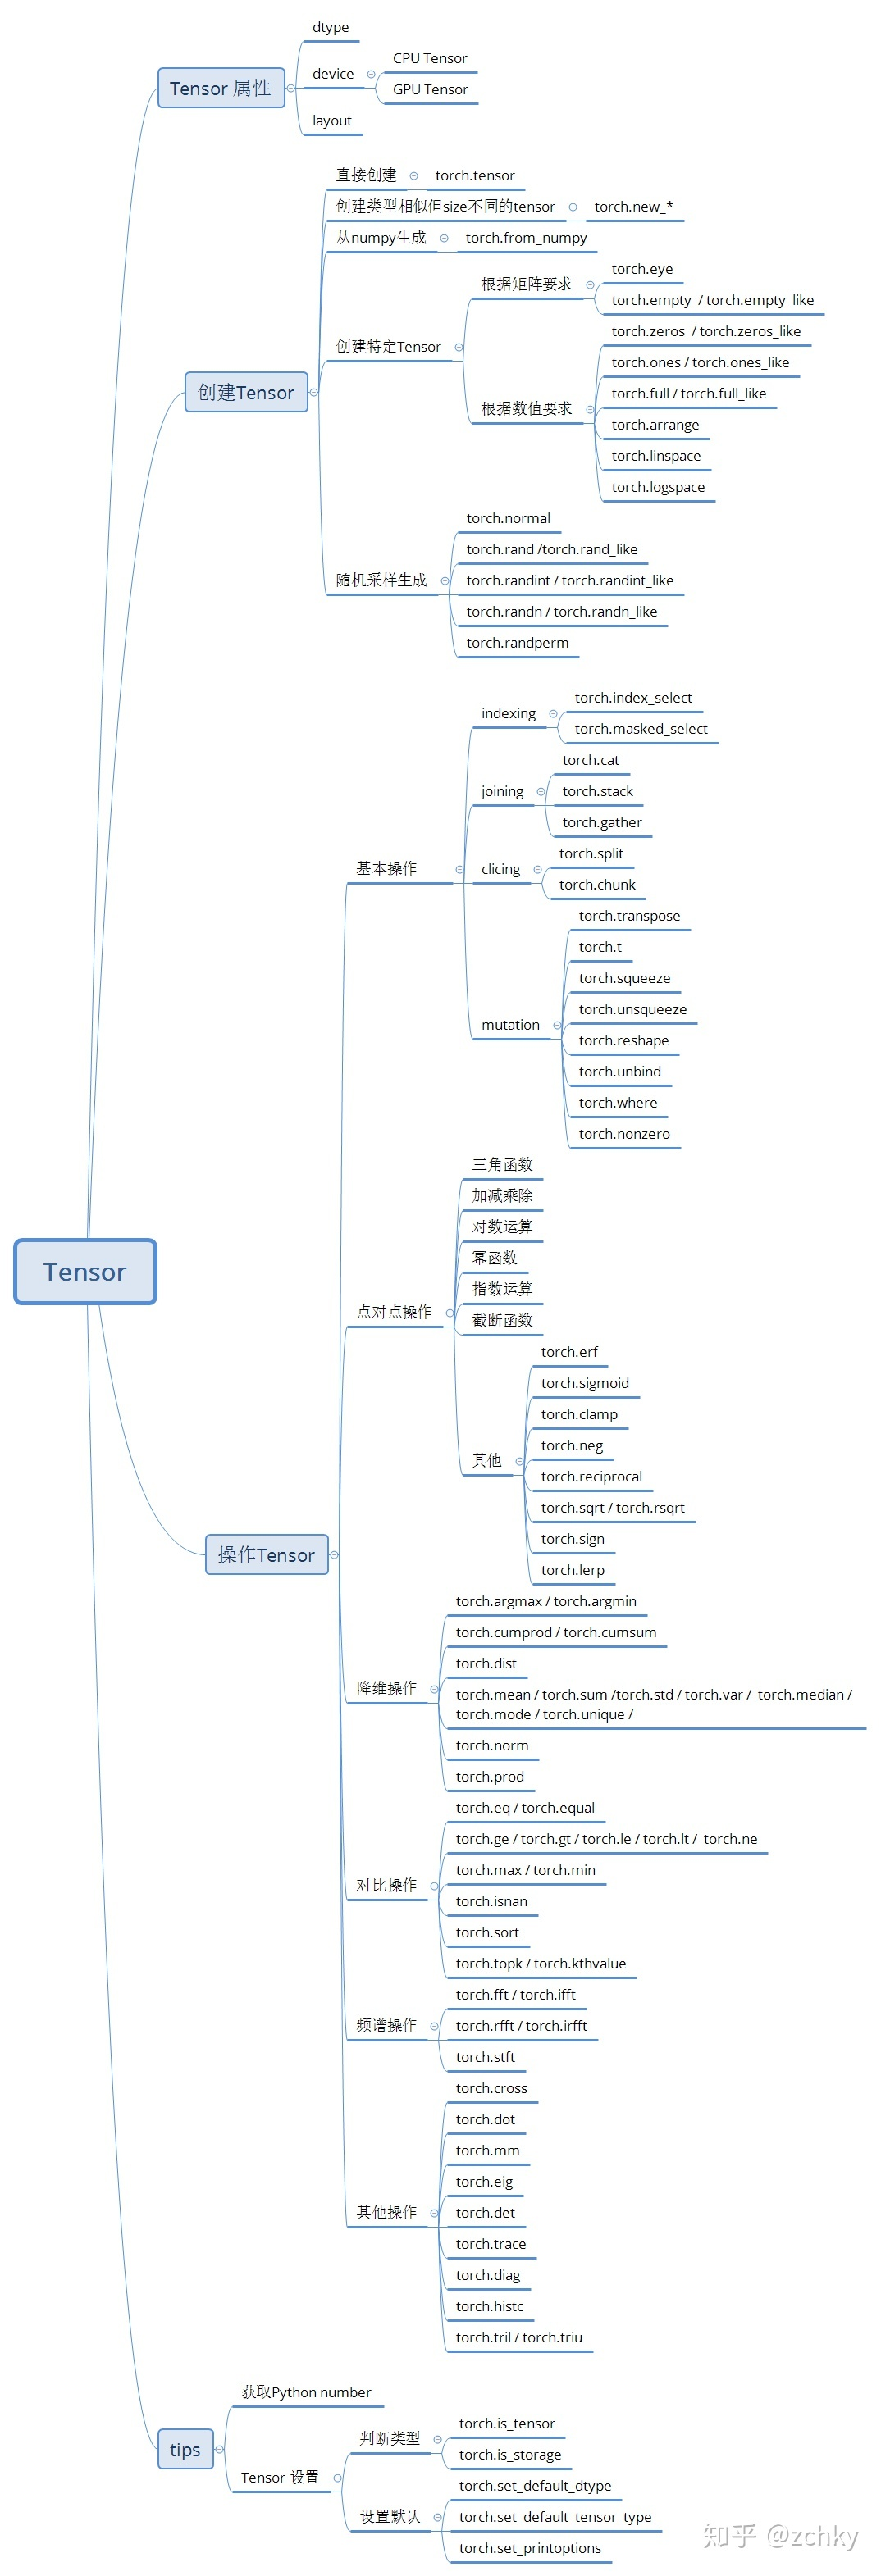
31 张量
张量 张量如同数组和矩阵一样, 是一种特殊的数据结构。在PyTorch中, 神经网络的输入、输出以及网络的参数等数据, 都是使用张量来进行描述。 张量的使用和Numpy中的ndarrays很类似, 区别在于张量可以在GPU或其它专用硬件上运行, 这样可以得到更快的加速效果。如果你对ndarrays很熟悉的话, 张量的使用对你来说就很容易了。如果不太熟悉的话, 希望这篇有关张量API的快速入门教程能够帮到你。 12import torchimport numpy as np 1 张量初始化张量有很多种不同的初始化方法, 先来看看四个简单的例子: 1. 直接生成张量由原始数据直接生成张量, 张量类型由原始数据类型决定。 12data = [[1, 2], [3, 4]]x_data = torch.tensor(data) 2. 通过Numpy数组来生成张量由已有的Numpy数组来生成张量(反过来也可以由张量来生成Numpy数组, 参考张量与Numpy之间的转换)。 12np_array = np.array(data)x_np = torch.from_numpy(np_arr...

2020-09-26
errorbar_features
误差条形图的不同方法可以将错误指定为常数值(如errorbar_demo.py中所示)。但是,此示例通过指定错误值数组来演示它们的不同之处。 如果原始x和y数据的长度为N,则有两个选项: 数组形状为(N,): 每个点的误差都不同,但误差值是对称的(即,上下两个值相等)。 数组形状为(2, N): 每个点的误差不同,并且下限和上限(按该顺序)不同(非对称情况)。 此外,此示例演示如何使用带有误差线的对数刻度。 123456789101112131415161718192021222324import numpy as npimport matplotlib.pyplot as plt# example datax = np.arange(0.1, 4, 0.5)y = np.exp(-x)# example error bar values that vary with x-positionerror = 0.1 + 0.2 * xfig, (ax0, ax1) = plt.subplots(nrows=2, sharex=True)ax0.errorbar(x, y, ye...
2021-03-12
2 链表
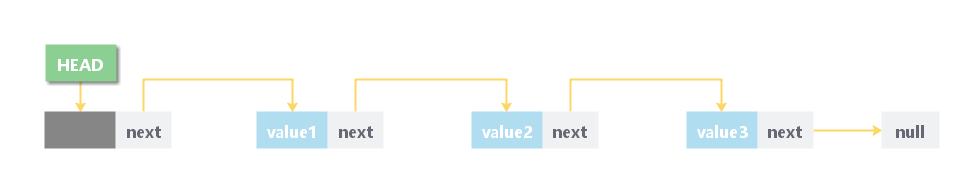
链表1 简介链表概念 链表是一种随机存储在内存中的节点对象集合。 节点包含两个字段,即存储在该地址的数据和包含下一个节点地址的指针。 链表的最后一个节点包含指向null的指针。 链表特点 链表不需要连续存在于存储器中。节点可以是存储器中的任何位置并链接在一起以形成链表。这实现了空间的优化利用。 链表大小仅限于内存大小,不需要提前声明。 空节点不能出现在链表中。 在单链表中存储基元类型或对象的值。 链表与数组的对比 数组有以下限制: 在程序中使用数组之前,必须事先知道数组的大小。 增加数组的大小是一个耗时的过程。在运行时几乎不可能扩展数组的大小。 数组中的所有元素都需要连续存储在内存中。在数组中插入任何元素都需要移动元素之前所有的数据。 链表是可以克服数组所有限制的数据结构。 链表是非常有用的,因为, 它动态分配内存。链表的所有节点都是非连续存储在存储器中,并使用指针链接在一起。 大小调整不再是问题,因为不需要在声明时定义大小。链表根据程序的需求增长,并且仅限于可用的内存空间。 2 链表的类型分类 单链表 双链表 循环单链表 循环双链表

2020-09-26
agg_buffer_to_array
Agg缓冲区转换数组将渲染图形转换为其图像(NumPy数组)表示形式。 1234567891011121314151617import matplotlib.pyplot as pltimport numpy as np# make an agg figurefig, ax = plt.subplots()ax.plot([1, 2, 3])ax.set_title('a simple figure')fig.canvas.draw()# grab the pixel buffer and dump it into a numpy arrayX = np.array(fig.canvas.renderer._renderer)# now display the array X as an Axes in a new figurefig2 = plt.figure()ax2 = fig2.add_subplot(111, frameon=False)ax2.imshow(X)plt.show() 下载这个示例 下载python源码: agg_buffer_...


