
hexbin_demo
Hexbin 演示
使用Matplotlib绘制hexbins。
Hexbin是一种轴方法或pyplot函数,它基本上是具有六边形单元的二维直方图的pcolor。 它可以比散点图更具信息性。 在下面的第一个图中,尝试用’scatter’代替’hexbin’。

1 | import numpy as np |
下载这个示例
本博客所有文章除特别声明外,均采用 CC BY-NC-SA 4.0 许可协议。转载请注明来源 Estom的博客!
相关推荐
2021-03-20
5
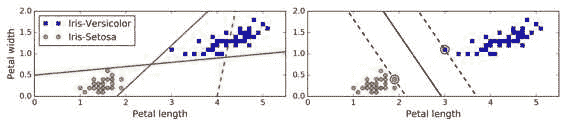
五、支持向量机 译者:@QiaoXie 校对者:@飞龙、@PeterHo、@yanmengk、@YuWang 支持向量机(SVM)是个非常强大并且有多种功能的机器学习模型,能够做线性或者非线性的分类,回归,甚至异常值检测。机器学习领域中最为流行的模型之一,是任何学习机器学习的人必备的工具。SVM 特别适合应用于复杂但中小规模数据集的分类问题。 本章节将阐述支持向量机的核心概念,怎么使用这个强大的模型,以及它是如何工作的。 线性支持向量机分类SVM 的基本思想能够用一些图片来解释得很好,图 5-1 展示了我们在第 4 章结尾处介绍的鸢尾花数据集的一部分。这两个种类能够被非常清晰,非常容易的用一条直线分开(即线性可分的)。左边的图显示了三种可能的线性分类器的判定边界。其中用虚线表示的线性模型判定边界很差,甚至不能正确地划分类别。另外两个线性模型在这个数据集表现的很好,但是它们的判定边界很靠近样本点,在新的数据上可能不会表现的很好。相比之下,右边图中 SVM 分类器的判定边界实线,不仅分开了两种类别,而且还尽可能地远离了最靠近的训练数据点。你可以认为 SVM 分类器在两种类别之间保持...
2021-04-07
20 Lua脚本
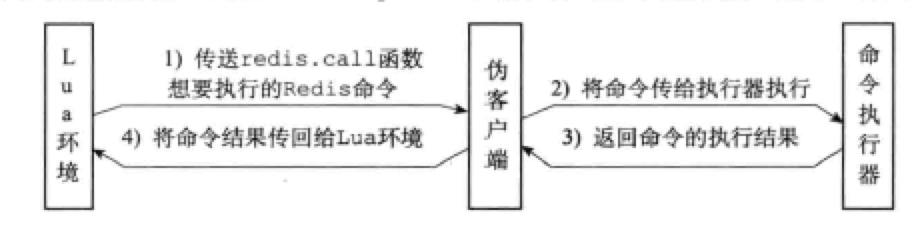
Redis从2.6版本开始引入对Lua脚本的支持,通过在服务器中嵌入Lua环境,Redis客户端可以使用Lua脚本,直接在服务器原子地执行多个Redis命令。 EVAL命令可以直接对输入的脚本进行求值: EVAL “return ‘hello world’” 0 “hello world” EVALSHA命令可以根据脚本的SHA1校验和来对脚本进行求值,但这个命令要求校验和对应的脚本至少被EVAL命令执行过一次,或者被SCRIPT LOAD命令载入过。 20.1 创建并修改Lua环境Redis服务器创建并修改Lua环境的整个过程有以下步骤: 创建一个基础的Lua环境 载入多个函数库到Lua环境 创建全局表格redis,表格包含了对Redis进行操作的函数,如redis.call 使用Redis自制的随机函数来替换Lua原有的带有副作用的随机函数 创建排序辅助函数 创建redis.pcall函数的错误报告辅助函数,这个函数可以提供更详细的出错信息 对Lua环境中的全局变量进行保护,防止用户在执行Lua脚本时添加额外的全局变量 将完成修改的Lua环境保存到服务器状态的lua属性...

2020-09-26
compound_path
复合路径制作复合路径 - 在这种情况下是两个简单的多边形,一个矩形和一个三角形。使用 CLOSEPOLY 和 MOVETO 作为复合路径的不同部分。 123456789101112131415161718192021222324252627import numpy as npfrom matplotlib.path import Pathfrom matplotlib.patches import PathPatchimport matplotlib.pyplot as pltvertices = []codes = []codes = [Path.MOVETO] + [Path.LINETO]*3 + [Path.CLOSEPOLY]vertices = [(1, 1), (1, 2), (2, 2), (2, 1), (0, 0)]codes += [Path.MOVETO] + [Path.LINETO]*2 + [Path.CLOSEPOLY]vertices += [(4, 4), (5, 5), (5, 4), (0, 0)]vertices = np.array(v...

2020-09-26
tricontour_demo
Tricontour 演示非结构化三角形网格的等高线图。 123import matplotlib.pyplot as pltimport matplotlib.tri as triimport numpy as np 在不指定三角形的情况下创建三角剖分会导致点的Delaunay三角剖分。 123456789101112131415161718192021# First create the x and y coordinates of the points.n_angles = 48n_radii = 8min_radius = 0.25radii = np.linspace(min_radius, 0.95, n_radii)angles = np.linspace(0, 2 * np.pi, n_angles, endpoint=False)angles = np.repeat(angles[..., np.newaxis], n_radii, axis=1)angles[:, 1::2] += np.pi / n_anglesx = (radii * np.cos(an...

2020-09-26
whats_new_99_mplot3d
0.99版本新增Mplot3d对象创建3D曲面图。 12345678910111213141516import numpy as npimport matplotlib.pyplot as pltfrom matplotlib import cmfrom mpl_toolkits.mplot3d import Axes3DX = np.arange(-5, 5, 0.25)Y = np.arange(-5, 5, 0.25)X, Y = np.meshgrid(X, Y)R = np.sqrt(X**2 + Y**2)Z = np.sin(R)fig = plt.figure()ax = Axes3D(fig)ax.plot_surface(X, Y, Z, rstride=1, cstride=1, cmap=cm.viridis)plt.show() 参考此示例中显示了以下函数,方法,类和模块的使用: 123import mpl_toolkitsmpl_toolkits.mplot3d.Axes3Dmpl_toolkits.mplot3d.Axes3D.plot_surf...

2020-09-26
quadmesh_demo
QuadMesh 演示pcolormesh 使用QuadMesh,一种更快的 pcolor 泛化,但有一些限制。 此演示说明了带有掩码数据的quadmesh中的误差。 12345678910111213141516171819202122232425262728293031323334import copyfrom matplotlib import cm, pyplot as pltimport numpy as npn = 12x = np.linspace(-1.5, 1.5, n)y = np.linspace(-1.5, 1.5, n * 2)X, Y = np.meshgrid(x, y)Qx = np.cos(Y) - np.cos(X)Qz = np.sin(Y) + np.sin(X)Z = np.sqrt(X**2 + Y**2) / 5Z = (Z - Z.min()) / (Z.max() - Z.min())# The color array can include masked values.Zm = np.ma.masked_where(np.abs...


