
hist
直方图
演示如何使用matplotlib绘制直方图。
1 | import matplotlib.pyplot as plt |
生成数据并绘制简单的直方图
要生成一维直方图,我们只需要一个数字矢量。对于二维直方图,我们需要第二个矢量。我们将在下面生成两者,并显示每个向量的直方图。
1 | N_points = 100000 |

更新直方图颜色
直方图方法(除其他外)返回一个修补程序对象。这使我们可以访问所绘制对象的特性。使用这个,我们可以根据自己的喜好编辑直方图。让我们根据每个条的y值更改其颜色。
1 | fig, axs = plt.subplots(1, 2, tight_layout=True) |

绘制二维直方图
要绘制二维直方图,只需两个长度相同的向量,对应于直方图的每个轴。
1 | fig, ax = plt.subplots(tight_layout=True) |

自定义直方图
自定义2D直方图类似于1D情况,您可以控制可视组件,如存储箱大小或颜色规格化。
1 | fig, axs = plt.subplots(3, 1, figsize=(5, 15), sharex=True, sharey=True, |

下载这个示例
本博客所有文章除特别声明外,均采用 CC BY-NC-SA 4.0 许可协议。转载请注明来源 Estom的博客!
相关推荐

2020-07-08
07 数据访问-3MyBatis
对象关系映射模型Hibernate。用来实现非常轻量级的对象的封装。将对象与数据库建立映射关系。实现增删查改。MyBatis与Hibernate非常相似。对象关系映射模型ORG。java对象与关系数据库映射的模型。 1 配置MyBatis最佳实践最佳实战:● 引入mybatis-starter● 配置application.yaml中,指定mapper-location位置即可● 编写Mapper接口并标注@Mapper注解● 简单方法直接注解方式● 复杂方法编写mapper.xml进行绑定映射● @MapperScan(“com.atguigu.admin.mapper”) 简化,其他的接口就可以不用标注@Mapper注解 添加MyBatis依赖12345678910<dependency> <groupId>org.mybatis.spring.boot</groupId> <artifactId>mybatis-spring-boot-starter</artifactId> <vers...

2022-02-23
0 基础使用
教程 参考文献 官方文档 0 简单介绍图的类型 Graph类是无向图的基类,无向图能有自己的属性或参数,不包含重边,允许有回路,节点可以是任何hash的python对象,节点和边可以保存key/value属性对。该类的构造函数为Graph(data=None,**attr),其中data可以是边列表,或任意一个Networkx的图对象,默认为none;attr是关键字参数,例如key=value对形式的属性。 MultiGraph是可以有重边的无向图,其它和Graph类似。其构造函数MultiGraph(data=None, *attr)。 DiGraph是有向图的基类,有向图可以有数自己的属性或参数,不包含重边,允许有回路;节点可以是任何hash的python对象,边和节点可含key/value属性对。该类的构造函数DiGraph(data=None,**attr),其中data可以是边列表,或任意一个Networkx的图对象,默认为none;attr是关键字参数,例如key=value对形式的属性。 ...
2022-12-04
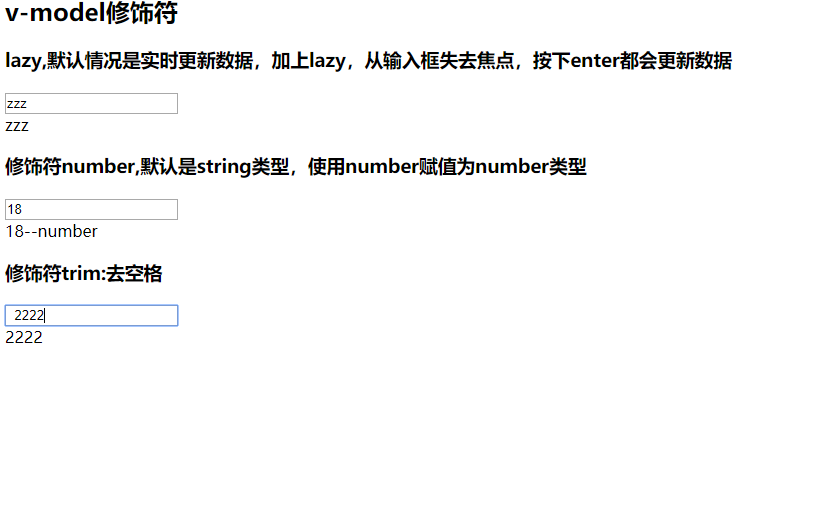
10-v-model
# 1. v-model的基本使用 123456789101112131415161718192021<!DOCTYPE html><html lang="en"><head> <meta charset="UTF-8"> <title>Title</title></head><body><div id="app"> <input type="text" v-model="message">{{message}}</div><script src="../js/vue.js"></script><script> const app = new Vue({ el: '#app', ...

2020-09-25
14字节交换
在几乎所有的机器上,多字节对象都被存储为连续的字节序列。字节顺序,是跨越多字节的程序对象的存储规则。 大端模式:指数据的高字节保存在内存的低地址中,而数据的低字节保存在内存的高地址中,这样的存储模式有点儿类似于把数据当作字符串顺序处理:地址由小向大增加,而数据从高位往低位放;这和我们的阅读习惯一致。 小端模式:指数据的高字节保存在内存的高地址中,而数据的低字节保存在内存的低地址中,这种存储模式将地址的高低和数据位权有效地结合起来,高地址部分权值高,低地址部分权值低。 numpy.ndarray.byteswap()1234567891011121314151617181920212223import numpy as np a = np.array([1, 256, 8755], dtype = np.int16) print ('我们的数组是:')print (a)print ('以十六进制表示内存中的数据:')print (map(hex,a))# byteswap() 函数通过传入 true 来原地交换 print (...

2022-12-05
28.你知道哪些设计模式?分别对应的应用场景有哪些?
你知道哪些设计模式?分别对应的应用场景有哪些?上一课时我们讲了单例模式的 8 种实现方式以及它的优缺点,可见设计模式的内容是非常丰富且非常有趣。我们在一些优秀的框架中都能找到设计模式的具体使用,比如前面 MyBatis 中(第 13 课时)讲的那些设计模式以及具体的使用场景,但由于设计模式的内容比较多,有些常用的设计模式在 MyBatis 课时中并没有讲到。因此本课时我们就以全局的视角,来重点学习一下这些常用设计模式。 我们本课时的面试题是,你知道哪些设计模式?它的使用场景有哪些?它们有哪些优缺点? 典型回答设计模式从大的维度来说,可以分为三大类:创建型模式、结构型模式及行为型模式,这三大类下又有很多小分类。 创建型模式是指提供了一种对象创建的功能,并把对象创建的过程进行封装隐藏,让使用者只关注具体的使用而并非对象的创建过程。它包含的设计模式有单例模式、工厂模式、抽象工厂模式、建造者模式及原型模式。 结构型模式关注的是对象的结构,它是使用组合的方式将类结合起来,从而可以用它来实现新的功能。它包含的设计模式是代理模式、组合模式、装饰模式及外观模式。 行为型模式关注的是对象的行为,它...

2022-04-18
web-workers
基础内容什么是 Web Workers 能够把 JavaScript 计算委托给后台线程,通过允许这些活动以防止使交互型事件变得缓慢。 上句话是 MDN 对象 Web Workers 的简单描述。 Web Workers 是可以在后台(页面端)运行的任务,它能够被轻松的创建,还能向它的创建者发送消息。 Web Workers 的三大主要特征:能够长时间运行(响应),理想的启动性能以及理想的内存消耗。 两种 Web WorkersWeb Workers 可以分为两种类型:Dedicated Web Worker(专用线程)和 Shared Web Worker(共享线程)。 a. Dedicated Web Worker目前绝大多数的应用场景所使用的是 Dedicated Web Worker(专用线程)。Dedicated Web Worker随着 HTML 页面关闭而被终止,这就意味着 Dedicated Web Worker 只能被创建它的 HTML 页面所访问。 在 JavaScript 代码中,Work 类型代表 Dedicated Web Worker。 b. Sh...


