
histogram_features
直方图(hist)函数的几个特性演示
除基本直方图外,此演示还显示了一些可选功能:
- 设置数据箱的数量。
标准化标志,用于标准化箱高度,使直方图的积分为1.得到的直方图是概率密度函数的近似值。- 设置条形的面部颜色。
- 设置不透明度(alpha值)。
选择不同的存储量和大小会显著影响直方图的形状。Astropy文档有很多关于如何选择这些参数的部分。
1 | import matplotlib |

参考
此示例显示了以下函数和方法的使用:
1 | matplotlib.axes.Axes.hist |
下载这个示例
本博客所有文章除特别声明外,均采用 CC BY-NC-SA 4.0 许可协议。转载请注明来源 Estom的博客!
相关推荐

2020-09-26
histogram_histtypes
演示直方图函数的不同histtype设置 具有颜色填充的步进曲线的直方图。 具有自定义和不相等的箱宽度的直方图。 选择不同的存储量和大小会显著影响直方图的形状。Astropy文档有很多关于如何选择这些参数的部分: http://docs.astropy.org/en/stable/visualization/histogram.html 123456789101112131415161718192021import numpy as npimport matplotlib.pyplot as pltnp.random.seed(19680801)mu = 200sigma = 25x = np.random.normal(mu, sigma, size=100)fig, (ax0, ax1) = plt.subplots(ncols=2, figsize=(8, 4))ax0.hist(x, 20, density=True, histtype='stepfilled', facecolor='g', alpha=0.75)ax0.se...

2024-04-10
04 3.自定义请求和搭建集群
4 自定义Jmeter采样器 步骤 动作 1 创建一个Java类并继承AbstractJavaSamplerClient 2 实现setupTest方法,用于初始化 3 实现runTest方法,用于执行具体的请求 4 实现teardownTest方法,用于清理资源 5 编译并将生成的jar文件放入JMeter的lib/ext目录下 6 在JMeter中创建一个新的线程组 7 添加一个Java Request到线程组中,并设置相应的参数 8 运行测试,查看结果 步骤 1: 创建一个Java类并继承 AbstractJavaSamplerClient引入对应的依赖 1234567891011<dependency> <groupId>org.apache.jmeter</groupId> <artifactId>ApacheJMeter_core</artifactId> <version>4.0</version></depen...

2021-12-24
vgchange
vgchange修改卷组属性 补充说明vgchange命令 用于修改卷组的属性,经常被用来设置卷组是处于活动状态或非活动状态。处于活动状态的卷组无法被删除,必须使用vgchange命令将卷组设置为非活动状态后才能删除。 语法1vgchange(选项)(参数) 选项1-a:设置卷组的活动状态。 参数卷组:指定要设置属性的卷组。 实例使用vgchange命令将卷组状态改为活动的。在命令行中输入下面的命令: 1[root@localhost ~]# vgchange -ay vg1000 #将卷组"vg1000"设置为活动状态 输出信息如下: 11 logical volume(s) in volume group "vg1000" now active
2021-04-07
05 生命周期
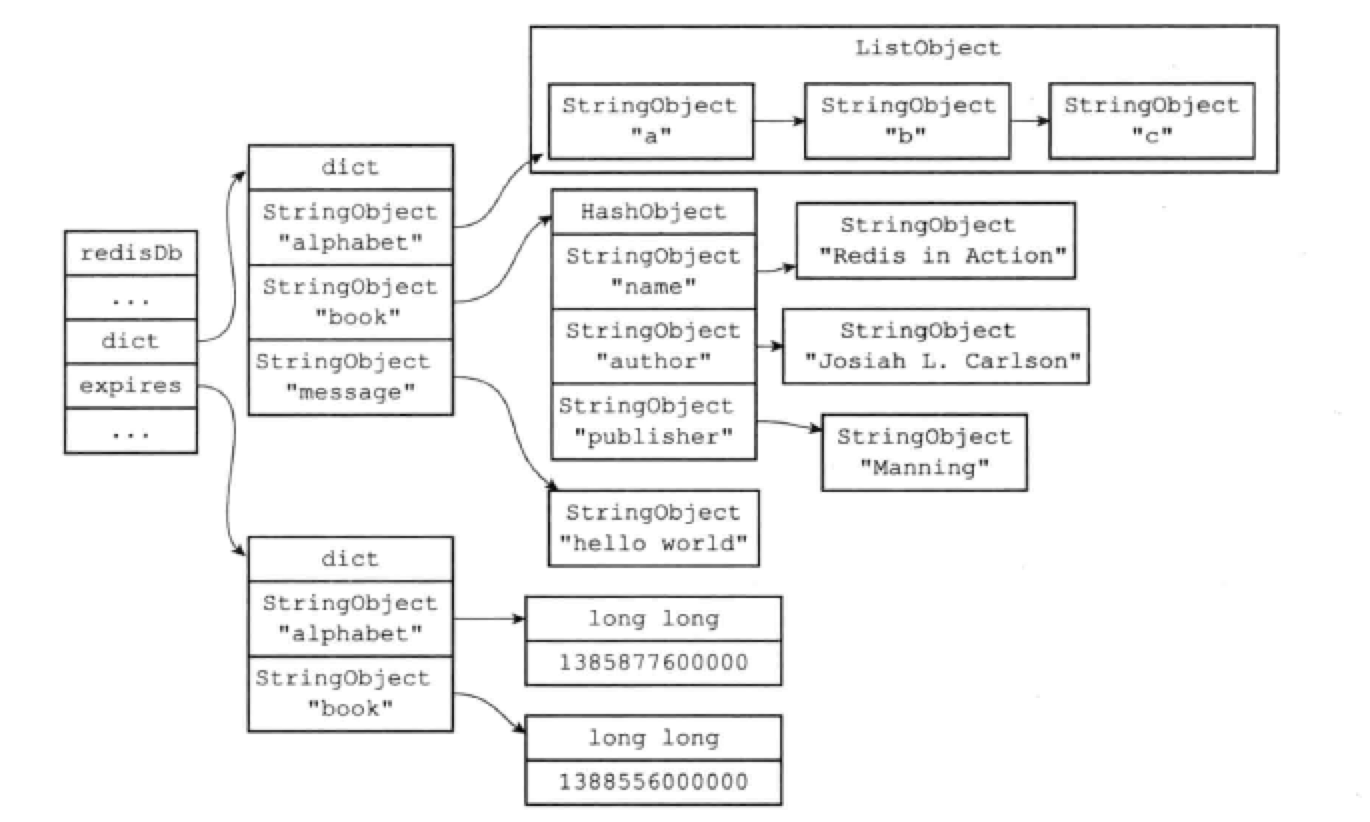
生命周期1 数据库键生命周期概述Redis 可以为每个键设置过期时间,当键过期时,会自动删除该键。 对于散列表这种容器,只能为整个键设置过期时间(整个散列表),而不能为键里面的单个元素设置过期时间。 设置键的生存时间或过期时间EXPIRE或PEXPIRE命令让客户端可以以秒或者毫秒进度为某个键设置生存时间。经过指定的时间后,服务器会自动删除生存时间为0的键。 EXPIREAT或PEXPIREAT命令,以秒或毫秒精度为某个键设置过期时间,过期时间是一个UNIX时间戳。 TTL和PTTL命令可查看某个键的剩余生存时间。 实际上,EXPIRE、PEXPIRE、EXPIREAT三个命令都是使用PEXPIREAT来实现的。 保存过期时间redisDb结构的expires字典保存了所有键的过期时间: 过期字典的键是一个指针,指向键空间中的某个键对象。 过期字典的值是一个long long类型的整数,保存了一个UNIX时间戳。 12345typedef struct redisDb { // ... dict *expires; // ...} redisDb; ...

2021-03-09
4 函数
>函数 >>函数定义:完成特定功能的一个语句组,这组语句可以作为一个单位使用,并且给他求个名字,通过函数名执行 >>语法: [python] viewplaincopy <span style=”font-size:18px;”> def print_sum(start, stop): “”” to calculate the sum from start to stop “”” result = 0 for i in range(star, stop + 1): result += i print ‘sum is’, result</span> 第一行定义了一个函数,关键字 def ,函数名 print_sum,函数参数start, stop >>函数调用 [python] viewplaincopy <span style=”font-size:18px;”>print_sum(a, b)</span>...
2021-03-20
28
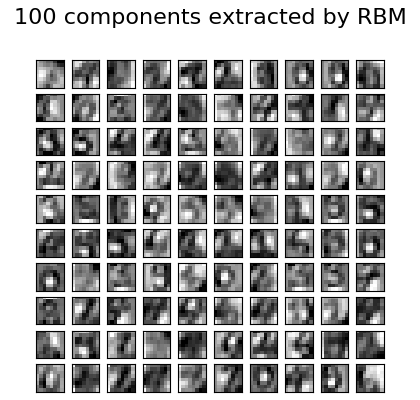
2.9. 神经网络模型(无监督)校验者: @不将就 @Loopy @barrycg @N!no翻译者: @夜神月 2.9.1. 限制波尔兹曼机限制玻尔兹曼机(Restricted Boltzmann machines,简称 RBM)是基于概率模型的无监督非线性特征学习器。当用 RBM 或多层次结构的RBMs 提取的特征在馈入线性分类器(如线性支持向量机或感知机)时通常会获得良好的结果。 该模型对输入的分布作出假设。目前,scikit-learn 只提供了 BernoulliRBM,它假定输入是二值(binary values)的,或者是 0 到 1 之间的值,每个值都编码特定特征被激活的概率。 RBM 尝试使用特定图形模型最大化数据的似然。它所使用的参数学习算法(随机最大似然)可以防止特征表示偏离输入数据。这使得它能捕获到有趣的特征,但使得该模型对于小数据集和密度估计不太有效。 该方法在初始化具有独立 RBM 权值的深度神经网络时得到了广泛的应用。这种方法是无监督的预训练。 示例: Restricted ...


