
histogram_multihist
使用多个数据集演示直方图(hist)函数
绘制具有多个样本集的直方图并演示:
- 使用带有多个样本集的图例
- 堆积图
- 没有填充的步进曲线
- 不同样本量的数据集
选择不同的存储量和大小会显著影响直方图的形状。Astropy文档有很多关于如何选择这些参数的部分: http://docs.astropy.org/en/stable/visualization/histogram.html

1 | import numpy as np |
下载这个示例
本博客所有文章除特别声明外,均采用 CC BY-NC-SA 4.0 许可协议。转载请注明来源 Estom的博客!
相关推荐

2021-12-24
env
env显示系统中已存在的环境变量 补充说明env命令 用于显示系统中已存在的环境变量,以及在定义的环境中执行指令。该命令只使用”-“作为参数选项时,隐藏了选项”-i”的功能。若没有设置任何选项和参数时,则直接显示当前的环境变量。 如果使用env命令在新环境中执行指令时,会因为没有定义环境变量”PATH”而提示错误信息”such file or directory”。此时,用户可以重新定义一个新的”PATH”或者使用绝对路径。 语法1env(选项)(参数) 选项12-i:开始一个新的空的环境;-u<变量名>:从当前环境中删除指定的变量。 参数 变量定义:定义在新的环境中变量,定义多个变量定义用空格隔开。格式为“变量名=值”; 指定:指定要执行的指令和参数。 实例123456789101112131415161718192021[root@localhost ~]# envhostname=LinServ-1TERM=linuxSHELL=/bin/bashHISTSIZE=1000SSH_CLIENT=192.168.2.111 2705 22SSH_T...

2020-10-13
13_Tips for Deep Learning
Tips for Deep Learning 本文会顺带解决CNN部分的两个问题:1、max pooling架构中用到的max无法微分,那在gradient descent的时候该如何处理?2、L1 的Regression到底是什么东西 本文的主要思路:针对training set和testing set上的performance分别提出针对性的解决方法1、在training set上准确率不高: new activation function:ReLU、Maxout adaptive learning rate:Adagrad、RMSProp、Momentum、Adam2、在testing set上准确率不高:Early Stopping、Regularization or Dropout Recipe of Deep Learningthree step of deep learningRecipe,配方、秘诀,这里指的是做deep learning的流程应该是什么样子 我们都已经知道了deep learning的三个步骤 define the function ...

2020-10-13
10_Keras
Keras2.0Why Keras你可能会问,为什么不学TensorFlow呢?明明tensorflow才是目前最流行的machine learning库之一啊。其实,它并没有那么好用,tensorflow和另外一个功能相近的toolkit theano,它们是非常flexible的,你甚至可以把它想成是一个微分器,它完全可以做deep learning以外的事情,因为它的作用就是帮你算微分,拿到微分之后呢,你就可以去算gradient descent之类,而这么flexible的toolkit学起来是有一定的难度的,你没有办法在半个小时之内精通这个toolkit 但是另一个toolkit——Keras,你是可以在数十分钟内就熟悉并精通它的,然后用它来implement一个自己的deep learning,Keras其实是tensorflow和theano的interface,所以用Keras就等于在用tensorflow,只是有人帮你把操纵tensorflow这件事情先帮你写好 所以Keras是比较容易去学习和使用的,并且它也有足够的弹性,除非你自己想要做deep learni...
2020-10-13
7_Logistic Regression
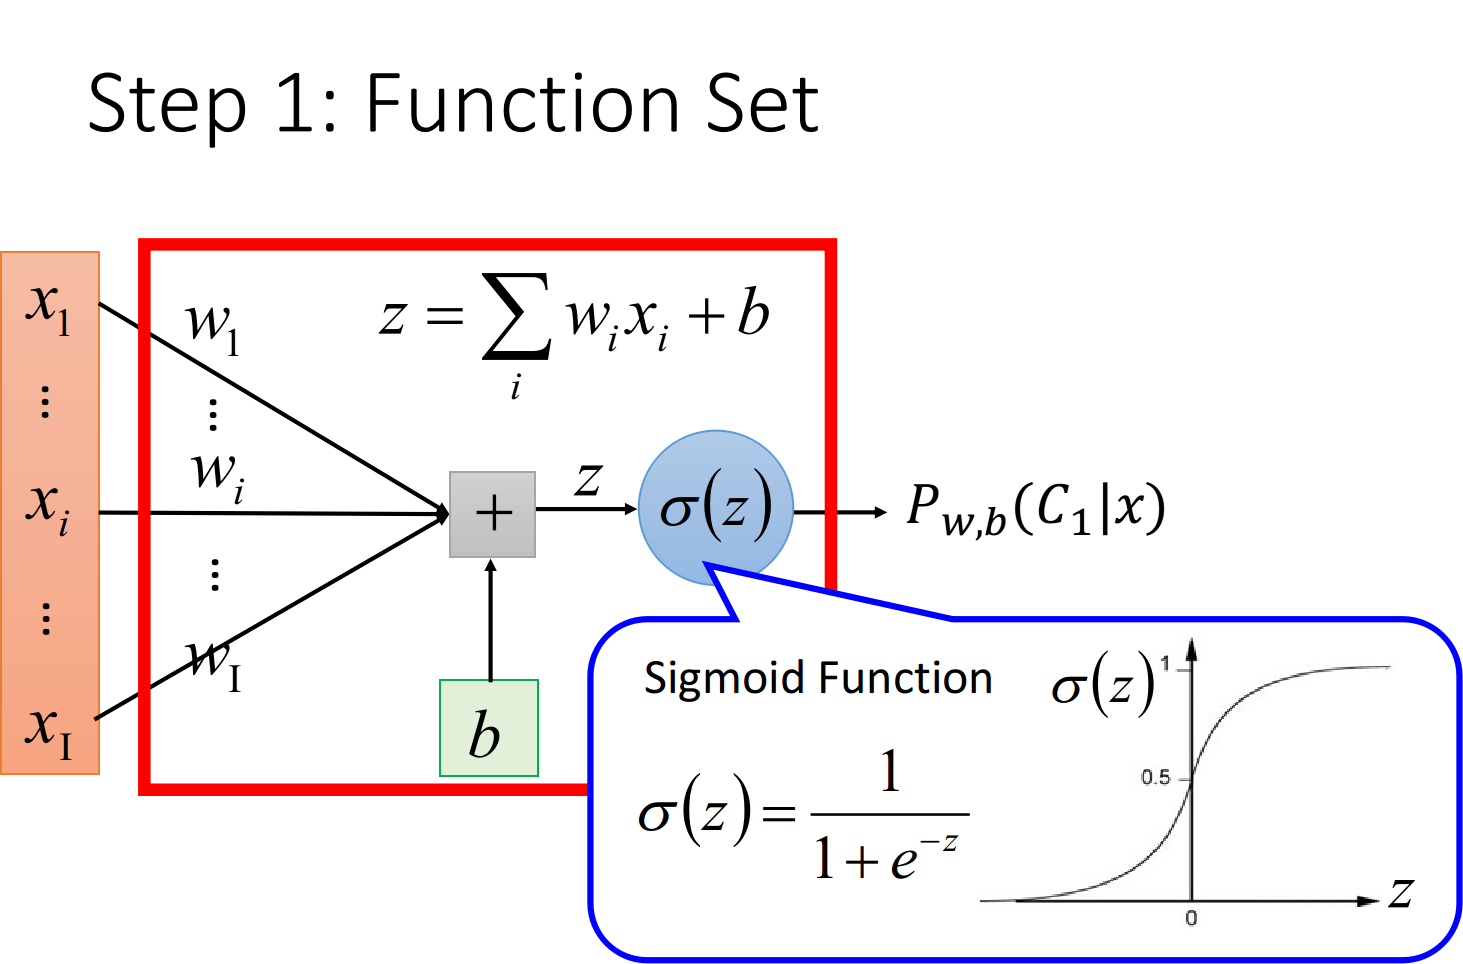
Logistic RegressionReview在classification这一章节,我们讨论了如何通过样本点的均值$u$和协方差$\Sigma$来计算$P(C_1),P(C_2),P(x|C_1),P(x|C_2)$,进而利用$P(C_1|x)=\frac{P(C_1)P(x|C_1)}{P(C_1)P(x|C_1)+P(C_2)P(x|C_2)}$计算得到新的样本点x属于class 1的概率,由于是二元分类,属于class 2的概率$P(C_2|x)=1-P(C_1|x)$ 之后我们还推导了$P(C_1|x)=\sigma(z)=\frac{1}{1+e^{-z}}$,并且在Gaussian的distribution下考虑class 1和class 2共用$\Sigma$,可以得到一个线性的z(其实很多其他的Probability model经过化简以后也都可以得到同样的结果)$$P_{w,b}(C_1|x)=\sigma(z)=\frac{1}{1+e^{-z}} \z&...

2021-03-22
48 分布式DataParallel与分布式RPC
将分布式DataParallel与分布式 RPC 框架相结合 原文:https://pytorch.org/tutorials/advanced/rpc_ddp_tutorial.html 作者: Pritam Damania 本教程使用一个简单的示例演示如何将DistributedDataParallel(DDP)与分布式 RPC 框架结合使用,以将分布式数据并行性与分布式模型并行性结合在一起,以训练简单模型。 该示例的源代码可以在中找到。 先前的教程分布式数据并行入门和分布式 RPC 框架入门分别描述了如何执行分布式数据并行训练和分布式模型并行训练。 虽然,有几种训练范例,您可能想将这两种技术结合起来。 例如: 如果我们的模型具有稀疏部分(较大的嵌入表)和密集部分(FC 层),则可能需要将嵌入表放在参数服务器上,并使用DistributedDataParallel。 分布式 RPC 框架可用于在参数服务器上执行嵌入查找。 如 PipeDream 论文中所述,启用混合并行性。 我们可以使用分布式 RPC 框架在多个工作程序之间流水线化模型的各个阶段,并使用Distribut...

2020-10-13
20_Unsupervised Learning Word Embedding
Unsupervised Learning: Word Embedding 本文介绍NLP中词嵌入(Word Embedding)相关的基本知识,基于降维思想提供了count-based和prediction-based两种方法,并介绍了该思想在机器问答、机器翻译、图像分类、文档嵌入等方面的应用 Introduction词嵌入(word embedding)是降维算法(Dimension Reduction)的典型应用 那如何用vector来表示一个word呢? 1-of-N Encoding最传统的做法是1-of-N Encoding,假设这个vector的维数就等于世界上所有单词的数目,那么对每一个单词来说,只需要某一维为1,其余都是0即可;但这会导致任意两个vector都是不一样的,你无法建立起同类word之间的联系 Word Class还可以把有同样性质的word进行聚类(clustering),划分成多个class,然后用word所属的class来表示这个word,但光做clustering是不够的,不同class之间关联依旧无法被有效地表达出来 Word Embed...


