
align_labels_demo
对齐标签
使用 Figure.align_xlabels 和 Figure.align_ylabels 对齐xlabel和ylabel
Figure.align_labels 包装了这两个函数。
注意,xlabel “XLabel11” 通常更接近x轴,“YLabel1 0” 将更接近其各自轴的y轴。

1 | import matplotlib.pyplot as plt |
下载这个示例
本博客所有文章除特别声明外,均采用 CC BY-NC-SA 4.0 许可协议。转载请注明来源 Estom的博客!
相关推荐

2020-09-26
fancybox_demo
Fancybox演示使用Matplotlib绘制精美的盒子。 以下示例显示如何绘制具有不同视觉属性的框。 1234import matplotlib.pyplot as pltimport matplotlib.transforms as mtransformsimport matplotlib.patches as mpatchfrom matplotlib.patches import FancyBboxPatch 首先,我们将展示一些带有fancybox的样本盒。 123456789101112131415styles = mpatch.BoxStyle.get_styles()spacing = 1.2figheight = (spacing * len(styles) + .5)fig1 = plt.figure(1, (4 / 1.5, figheight / 1.5))fontsize = 0.3 * 72for i, stylename in enumerate(sorted(styles)): fig1.text(0.5, (spacing * (len...
2021-03-20
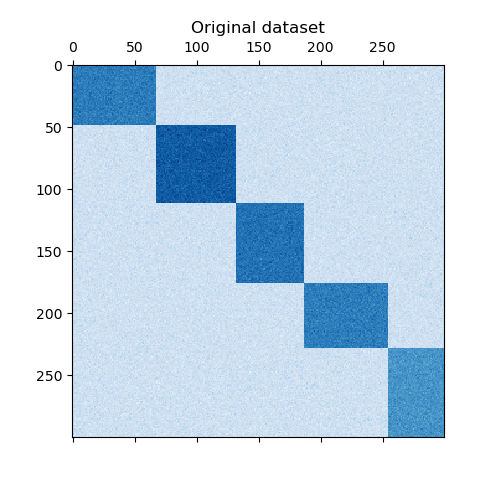
a_demo_of_the_spectral_co-clustering_algorithm
频谱共聚算法演示 翻译者:@N!no校验者:待校验 这个例子演示了如何使用谱协聚类算法生成数据集并对其进行双聚类处理。 数据集是使用 make_biclusters 函数生成的,该函数创建一个小值矩阵,并将大值植入双聚类。然后将行和列打乱并传递给光谱协聚算法。通过重新排列变换后的矩阵可以使双聚类连续,这展示出该算法找到双聚类的准确性。 1consensus score: 1.0 123456789101112131415161718192021222324252627282930313233343536373839404142print(__doc__)# Author: Kemal Eren <kemal@kemaleren.com># License: BSD 3 clauseimport numpy as npfrom matplotlib import pyplot as pltfrom sklearn.datasets import make_biclustersfrom sklearn.cluster import SpectralCoclus...
2021-04-10
1.2 开放封闭原则
1 开放封闭原则 OCP(Open Closed Principle) 为什么 “所有系统在其生命周期中都会进行变化,只要系统要开发一个版本以上这一点就需时刻记住。” All systems change during their life cycles. This must be borne in mind when developing systems expected to last longer than the first version. 在面向对象的设计中有很多流行的思想,比如说 “所有的成员变量都应该设置为私有(Private)” “要避免使用全局变量(Global Variables)” “使用运行时类型识别(RTTI:Run Time Type Identification,例如dynamic_cast)是危险的” 那么,这些思想的源泉是什么?为什么它们要这样定义?这些思想总是正确的吗?本篇文章将介绍这些思想的基础:开放封闭原则(Open Closed Principle)。 那么我们到底如何才能构建一个稳定的设计来面对这些变化,以使软件生命周期持...

2021-12-24
fishshell
fishshell比 bash 更好用的 shell 安装1234# Ubuntu 和 Debian 的安装方法。sudo apt-get install fish# Mac 的安装方法。brew install fish 启动与帮助由于 Fish 的语法与 Bash 有很大差异,Bash 脚本一般不兼容。因此,建议不要将 Fish 设为默认 Shell,而是每次手动启动它。 1234# 安装完成后,就可以启动 Fish。$ fish# 使用过程中,如果需要帮助,可以输入 help 命令$ help 彩色显示123456# 无效命令为红色$ mkd# 有效命令为蓝色$ mkdir# 有效路径会有下划线。如果没有下划线,你就知道这个路径不存在。$ cat ~/somefi 自动建议Fish 会自动在光标后面给出建议,表示可能的选项,颜色为灰色。如果采纳建议,可以按下 → 或 Control + F 。如果只采纳一部分,可以按下 Alt + →。 123$ /bin/hostname # 命令建议$ grep --ignore-case # 参数建议$ ls node_mod...

2020-09-26
annotation_basic
注释一个图像此示例显示如何使用指向提供的坐标的箭头注释绘图。我们修改箭头的默认值,以“缩小”它。 有关注释功能的完整概述,另请参阅注释教程。 1234567891011121314import numpy as npimport matplotlib.pyplot as pltfig, ax = plt.subplots()t = np.arange(0.0, 5.0, 0.01)s = np.cos(2*np.pi*t)line, = ax.plot(t, s, lw=2)ax.annotate('local max', xy=(2, 1), xytext=(3, 1.5), arrowprops=dict(facecolor='black', shrink=0.05), )ax.set_ylim(-2, 2)plt.show() 参考此示例中显示了以下函数,方法,类和模块的使用: 123import matplotlibmatplotlib.axes.Axes.annotatematplo...
2021-03-22
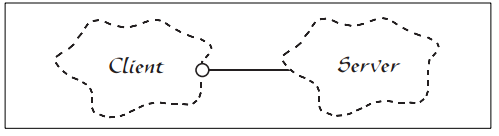
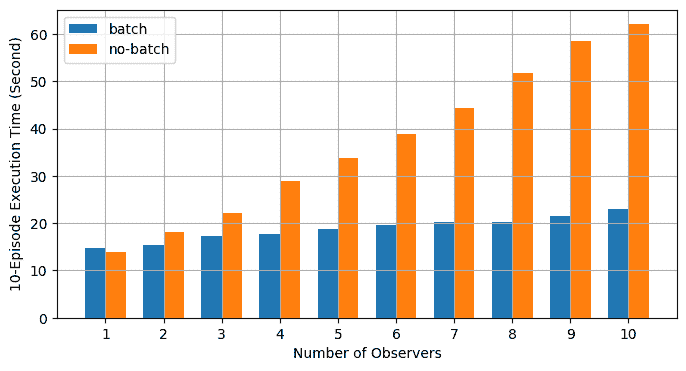
47 异步执行批量RPC处理
使用异步执行实现批量 RPC 处理 原文:https://pytorch.org/tutorials/intermediate/rpc_async_execution.html 作者:Shen Li 先决条件: PyTorch 分布式概述 分布式 RPC 框架入门 使用分布式 RPC 框架实现参数服务器 RPC 异步执行装饰器 本教程演示了如何使用@rpc.functions.async_execution装饰器来构建批量 RPC 应用,该装饰器通过减少阻止的 RPC 线程数和合并被调用方上的 CUDA 操作来帮助加快训练速度。 这使用 TorchServer 的相同想法进行批量推断。 注意 本教程需要 PyTorch v1.6.0 或更高版本。 基础知识先前的教程显示了使用torch.distributed.rpc构建分布式训练应用的步骤,但并未详细说明在处理 RPC 请求时被调用方发生的情况。 从 PyTorch v1.5 开始,每个 RPC 请求都会在被调用方上阻塞一个线程,以在该请求中执行该函数,直到该函数返回为止。 这适用于许多用例,但有一个警告。 如果用户函数例...


