
axes_demo
轴线演示
例如,使用plt.axes在主绘图轴中创建嵌入轴。

1 | import matplotlib.pyplot as plt |
下载这个示例
本博客所有文章除特别声明外,均采用 CC BY-NC-SA 4.0 许可协议。转载请注明来源 Estom的博客!
相关推荐

2021-12-24
arping
arping通过发送ARP协议报文测试网络 补充说明arping命令 是用于发送arp请求到一个相邻主机的工具,arping使用arp数据包,通过ping命令检查设备上的硬件地址。能够测试一个ip地址是否是在网络上已经被使用,并能够获取更多设备信息。功能类似于ping。 语法1arping(选项)(参数) 选项1234567-b:用于发送以太网广播帧(FFFFFFFFFFFF)。arping一开始使用广播地址,在收到响应后就使用unicast地址。-q:quiet output不显示任何信息;-f:表示在收到第一个响应报文后就退出;-w timeout:设定一个超时时间,单位是秒。如果到了指定时间,arping还没到完全收到响应则退出;-c count:表示发送指定数量的ARP请求数据包后就停止。如果指定了deadline选项,则arping会等待相同数量的arp响应包,直到超时为止;-s source:设定arping发送的arp数据包中的SPA字段的值。如果为空,则按下面处理,如果是DAD模式(冲突地址探测),则设置为0.0.0.0,如果是Unsolicited ARP模式...
2021-03-20
4 使用 scikit-learn 对数据分类
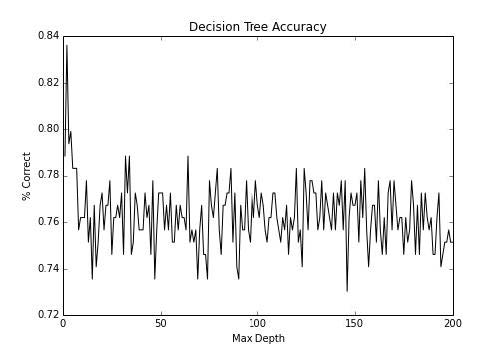
第四章 使用 scikit-learn 对数据分类 作者:Trent Hauck 译者:飞龙 协议:CC BY-NC-SA 4.0 分类在大量语境下都非常重要。例如,如果我们打算自动化一些决策过程,我们可以利用分类。在我们需要研究诈骗的情况下,有大量的事务,人去检查它们是不实际的。所以,我们可以使用分类都自动化这种决策。 4.1 使用决策树实现基本的分类这个秘籍中,我们使用决策树执行基本的分类。它们是非常不错的模型,因为它们很易于理解,并且一旦训练完成,评估就很容易。通常可以使用 SQL 语句,这意味着结果可以由许多人使用。 准备这个秘籍中,我们会看一看决策树。我喜欢将决策树看做基类,大量的模型从中派生。它是个非常简单的想法,但是适用于大量的情况。 首先,让我们获取一些分类数据,我们可以使用它来练习: 123>>> from sklearn import datasets >>> X, y = datasets.make_classification(n_samples=1000, n_features=3, ...
2021-03-20
47
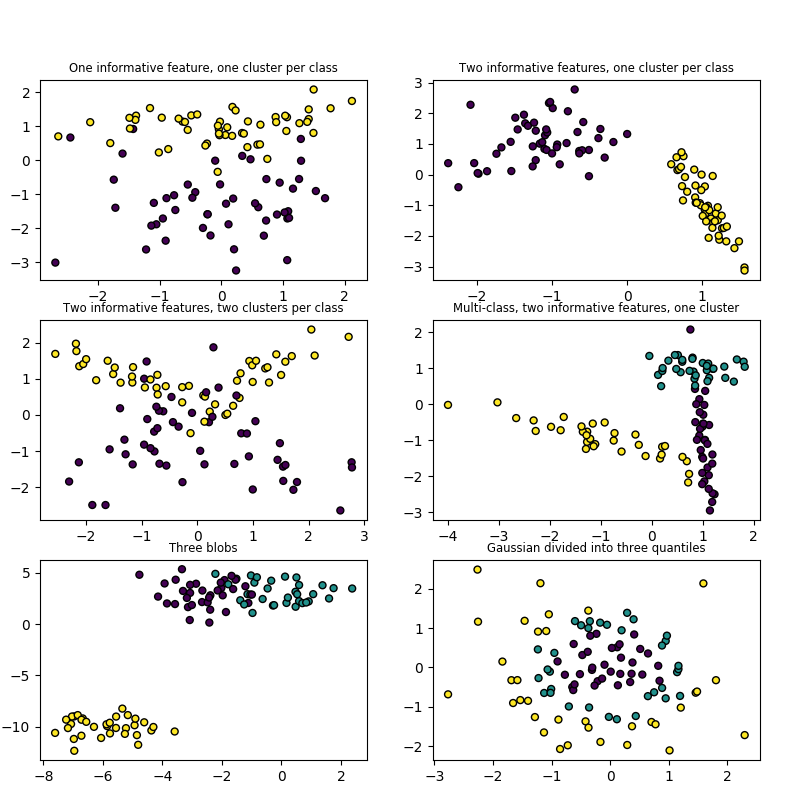
6. 数据集加载工具校验者: @不吃曲奇的趣多多 @A @火星 @Trembleguy @Loopy @mahaoyang翻译者: @cowboy @peels @t9UhoI @Sun 该 sklearn.datasets 包装在 入门指南 部分中嵌入了介绍一些小型玩具的数据集。 为了在控制数据的统计特性(通常是特征的 correlation (相关性)和 informativeness (信息性))的同时评估数据集 (n_samples 和 n_features) 的规模的影响,也可以生成综合数据。 这个软件包还具有帮助用户获取更大的数据集的功能,这些数据集通常由机器学习社区使用,用于对来自 ‘real world’ 的数据进行检测算法。 6.1. 通用数据集 API根据所需数据集的类型,有三种主要类型的数据集API接口可用于获取数据集。 loaders 可用来加载小的标准数据集,在玩具数据集中有介绍。 fetchers 可用来下载并加...

2020-09-26
fill_between_alpha
在和Alpha之间填充fill_between()函数在最小和最大边界之间生成阴影区域,这对于说明范围很有用。 它具有非常方便的用于将填充与逻辑范围组合的参数,例如,仅在某个阈值上填充曲线。 在最基本的层面上,fill_between 可用于增强图形的视觉外观。让我们将两个财务时间图与左边的简单线图和右边的实线进行比较。 1234567891011121314151617181920212223242526import matplotlib.pyplot as pltimport numpy as npimport matplotlib.cbook as cbook# load up some sample financial datawith cbook.get_sample_data('goog.npz') as datafile: r = np.load(datafile)['price_data'].view(np.recarray)# Matplotlib prefers datetime instead of np.dat...

2020-09-26
annotation_basic
注释一个图像此示例显示如何使用指向提供的坐标的箭头注释绘图。我们修改箭头的默认值,以“缩小”它。 有关注释功能的完整概述,另请参阅注释教程。 1234567891011121314import numpy as npimport matplotlib.pyplot as pltfig, ax = plt.subplots()t = np.arange(0.0, 5.0, 0.01)s = np.cos(2*np.pi*t)line, = ax.plot(t, s, lw=2)ax.annotate('local max', xy=(2, 1), xytext=(3, 1.5), arrowprops=dict(facecolor='black', shrink=0.05), )ax.set_ylim(-2, 2)plt.show() 参考此示例中显示了以下函数,方法,类和模块的使用: 123import matplotlibmatplotlib.axes.Axes.annotatematplo...
2021-03-20
26
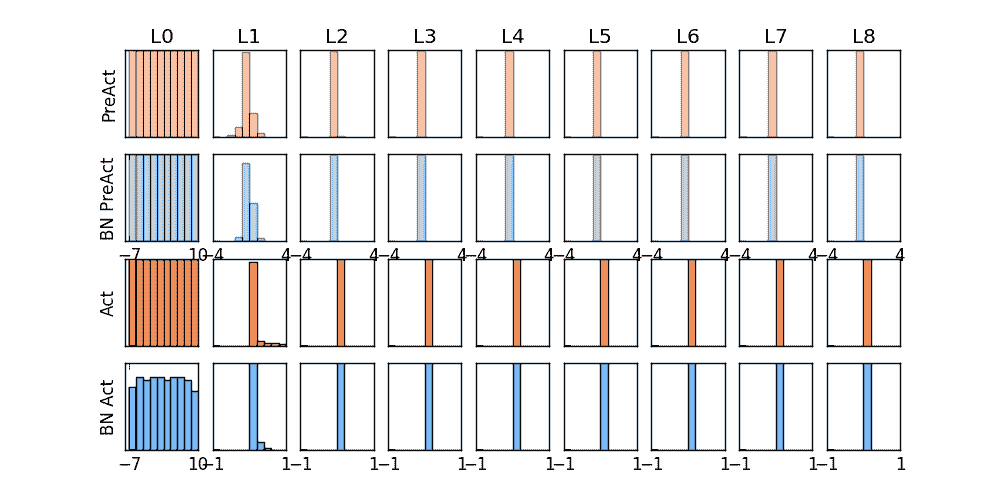
5.4 – Batch Normalization 批标准化批标准化通俗来说就是对每一层神经网络进行标准化 (normalize) 处理, 我们知道对输入数据进行标准化能让机器学习有效率地学习. 如果把每一层后看成这种接受输入数据的模式, 那我们何不 “批标准化” 所有的层呢? 具体而且清楚的解释请看到 我(原作者)制作的 什么批标准化 动画简介(推荐)(如下). 那我们就看看下面的两个动图, 这就是在每层神经网络有无 batch normalization 的区别啦. 做点数据自己做一些伪数据, 用来模拟真实情况. 而且 Batch Normalization (之后都简称BN) 还能有效的控制坏的参数初始化 (initialization), 比如说 ReLU 这种激励函数最怕所有的值都落在附属区间, 那我们就将所有的参数都水平移动一个 -0.2 ( bias_initialization = -0.2 , 来看看 BN 的实力. 12345678910111213141516171819202122232425262728293031323334353...


