
gridspec_multicolumn
使用GridSpec制作多列/行子图布局
GridSpec是布置子打印网格的一种灵活方式。下面是一个使用3x3网格和横跨所有三列、两列和两行的轴的示例。

1 | import matplotlib.pyplot as plt |
下载这个示例
本博客所有文章除特别声明外,均采用 CC BY-NC-SA 4.0 许可协议。转载请注明来源 Estom的博客!
相关推荐

2020-10-14
03超参数调试、Batch正则化和程序框架
超参数调试、Batch 正则化和程序框架超参数调试处理超参数重要程度排序 最重要: 学习率 α; 其次重要: β:动量衰减参数,常设置为 0.9; #hidden units:各隐藏层神经元个数; mini-batch 的大小; 再次重要: β1,β2,ϵ:Adam 优化算法的超参数,常设为 0.9、0.999、$10^{-8}$; #layers:神经网络层数; decay_rate:学习衰减率; 调参技巧 随机选择点(而非均匀选取),用这些点实验超参数的效果。这样做的原因是我们提前很难知道超参数的重要程度,可以通过选择更多值来进行更多实验; 由粗糙到精细:聚焦效果不错的点组成的小区域,在其中更密集地取值,以此类推; 选择合适的范围 对于学习率 α,用对数标尺而非线性轴更加合理:0.0001、0.001、0.01、0.1 等,然后在这些刻度之间对log值进行均匀选择。 对于 β,取 0.9 就相当于在 10 个值中计算平均值,而取 0.999 就相当于在 1000 个值中计算平均值。可以考虑给 1-β 取值,这样就和取学习率类似了。 上述操作的原因是当 β...

2019-11-30
第23节 距离判别
距离判别 分类:数据集带标签聚类:无标签数据集 1 欧氏距离与马氏距离定义:距离判别 判别分析:根据样品的观察值判定归属。 距离判别原理:对距离进行规定,就近原则判定样品的归属。 定义:欧氏距离$$d(x,y)=\sqrt{\sum_{i=1}^n(x_i-y_i)^2}\=\sqrt{(x-y)’(x-y)}$$ 缺点:指标的量纲不同,意义不同。距离会因各个指标单位的变化而改变 定义:马氏距离 声明$$p元总体G的均值\mu和协方差矩阵\Sigma(\Sigma>0)\x,y是取自G的两个样本$$ 结论$$马氏距离d(x,y)=\sqrt{(x-y)’\Sigma^{-1}(x-y)}$$ 马氏距离与欧氏距离只相差一个协方差矩阵。具体原理的理解放到第二轮复习当中。 性质 非负性:$d(x,y)\geq 0,当且仅当x=y时,d(x,y)=0$ 自反性:$d(x,y)=d(y,x)$ 三角不等式:对任意的$x,y,z$,有$d(x,z)\leqd(x,y)+d(y,z)$ 特点 当$\Si...
2021-03-20
a_demo_of_the_spectral_co-clustering_algorithm
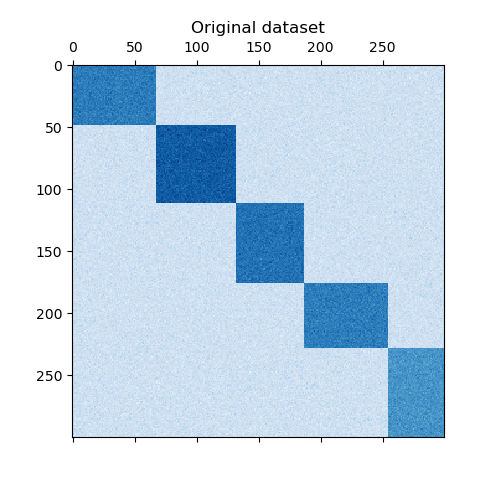
频谱共聚算法演示 翻译者:@N!no校验者:待校验 这个例子演示了如何使用谱协聚类算法生成数据集并对其进行双聚类处理。 数据集是使用 make_biclusters 函数生成的,该函数创建一个小值矩阵,并将大值植入双聚类。然后将行和列打乱并传递给光谱协聚算法。通过重新排列变换后的矩阵可以使双聚类连续,这展示出该算法找到双聚类的准确性。 1consensus score: 1.0 123456789101112131415161718192021222324252627282930313233343536373839404142print(__doc__)# Author: Kemal Eren <kemal@kemaleren.com># License: BSD 3 clauseimport numpy as npfrom matplotlib import pyplot as pltfrom sklearn.datasets import make_biclustersfrom sklearn.cluster import SpectralCoclus...

2021-12-24
read
read从键盘读取变量值 补充说明read命令 从键盘读取变量的值,通常用在shell脚本中与用户进行交互的场合。该命令可以一次读取多个变量的值,变量和输入的值都需要使用空格隔开。在read命令后面,如果没有指定变量名,读取的数据将被自动赋值给特定的变量REPLY 语法1read(选项)(参数) 选项12-p:指定读取值时的提示符;-t:指定读取值时等待的时间(秒)。 参数变量:指定读取值的变量名。 实例下面的列表给出了read命令的常用方式: 12read 1987name从标准输入读取输入并赋值给变量1987name。 12read first last从标准输入读取输入到第一个空格或者回车,将输入的第一个单词放到变量first中,并将该行其他的输入放在变量last中。 12read从标准输入读取一行并赋值给特定变量REPLY。 12read -a arrayname把单词清单读入arrayname的数组里。 12read -p "text"打印提示(text),等待输入,并将输入存储在REPLY中。 12read -r line允许输入包含...

2024-01-13
4 fetch
1 简介参考文件:https://developer.mozilla.org/zh-CN/docs/Web/API/Fetch_API/Using_Fetch 2 使用基本用法1234567891011121314151617181920212223// Example POST method implementation:async function postData(url = "", data = {}) { // Default options are marked with * const response = await fetch(url, { method: "POST", // *GET, POST, PUT, DELETE, etc. mode: "cors", // no-cors, *cors, same-origin cache: "no-cache", // *default, no-cache, reload,...

2020-09-26
ellipse_collection
椭圆集合绘制椭圆的集合。虽然使用 EllipseCollection 或PathCollection 同样可行,但使用EllipseCollection 可以实现更短的代码。 123456789101112131415161718192021222324252627import matplotlib.pyplot as pltimport numpy as npfrom matplotlib.collections import EllipseCollectionx = np.arange(10)y = np.arange(15)X, Y = np.meshgrid(x, y)XY = np.column_stack((X.ravel(), Y.ravel()))ww = X / 10.0hh = Y / 15.0aa = X * 9fig, ax = plt.subplots()ec = EllipseCollection(ww, hh, aa, units='x', offsets=XY, transOffset...


