
annotation_demo
注释图
以下示例显示了如何在matplotlib中注释绘图。这包括突出显示特定的兴趣点,并使用各种视觉工具来引起对这一点的关注。有关matplotlib中注释和文本工具的更完整和深入的描述,请参阅注释教程。
1 | import matplotlib.pyplot as plt |
指定文本点和注释点
您必须指定注释点 xy = (x, y) 来注释此点。另外,您可以为此注释的文本位置指定文本点 xytext=(x, y)。 (可选)您可以使用xycoords和textcoords的以下字符串之一指定xy和xytext的坐标系(默认为’data’):
1 | 'figure points' : points from the lower left corner of the figure |
注意:对于物理坐标系(点或像素),原点是图形或轴的(底部,左侧)。
(可选)您可以通过提供箭头属性字典来指定箭头属性,该属性可以从文本绘制和箭头到注释点
有效关键点是:
1 | width : the width of the arrow in points |
1 | # Create our figure and data we'll use for plotting |

使用多个坐标系和轴类型
您可以在不同位置和坐标系中指定xypoint和xytext,也可以选择打开连接线并使用标记标记点。 注释也适用于极轴。
在下面的示例中,xy点是本机坐标(xycoords默认为’data’)。对于极轴,这是在(θ,半径)空间中。示例中的文本放在小数字坐标系中。文本关键字args如水平和垂直对齐被尊重。
1 | fig, ax = plt.subplots(subplot_kw=dict(projection='polar'), figsize=(3, 3)) |


自定义箭头和气泡样式
xytext和注释点之间的箭头以及覆盖注释文本的气泡可高度自定义。 下面是一些参数选项以及它们的结果输出。
1 | fig, ax = plt.subplots(figsize=(8, 5)) |

更多坐标系的例子
下面我们将展示几个坐标系的例子,以及如何指定注释的位置。
1 | fig, (ax1, ax2) = plt.subplots(1, 2) |

下载这个示例
本博客所有文章除特别声明外,均采用 CC BY-NC-SA 4.0 许可协议。转载请注明来源 Estom的博客!
相关推荐

2021-09-02
gRPC介绍与安装
grpc是高性能的rpc框架,基于http2协议(双向流、头部压缩、多复用请求等),默认使用protobuf序列化协议 安装123456789# grpc编译器curl -fsSL https://goo.gl/getgrpc | bash -s -- --with-plugins# Golang protobuf插件# 编译后会安装protoc-gen-go到$GOBIN目录, 默认在 $GOPATH/bin. 该目录必须在系统的环境变量$PATH中,这样在编译.proto文件时protocol编译器才能找到插件go get -u github.com/golang/protobuf/{proto,protoc-gen-go}# grpc-gogo get -u google.golang.org/grpc 参考https://segmentfault.com/a/1190000007880647
2022-11-07
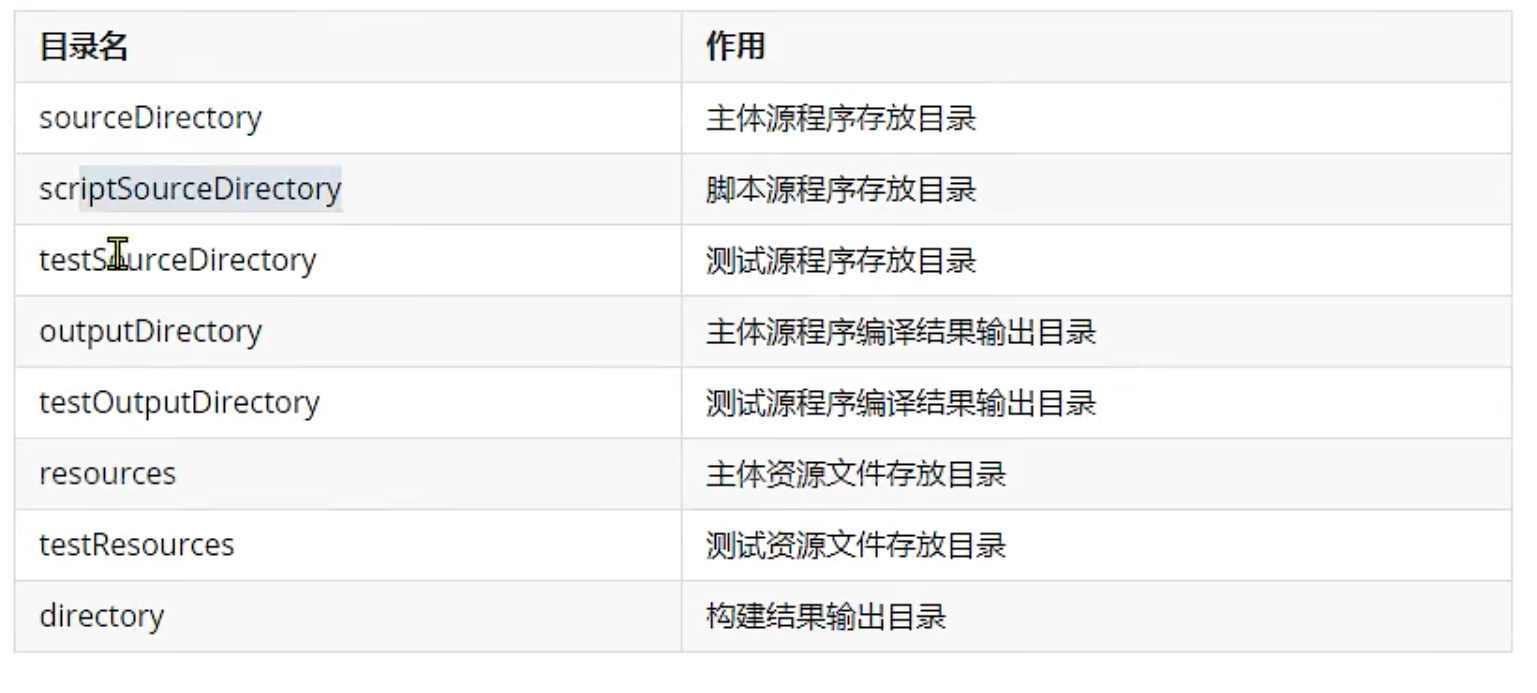
09 maven构建标签Build
1 概述本质上配置的Build标签是对超级POM配置的Build标签的叠加。(猜想 sofaboot的目录结构也是通过build标签定义了约定的目录结构。) 2 作用配置约定的目录结构Dir 12345678910111213141516171819<build> <sourceDirectory>/Users/yinkanglong/work/notes/maven/maven源码/project03-maven-test/src/main/java</sourceDirectory> <scriptSourceDirectory>/Users/yinkanglong/work/notes/maven/maven源码/project03-maven-test/src/main/scripts</scriptSourceDirectory> <testSourceDirectory>/Users/yinkanglong/work/notes/maven/maven源码/project03-mave...

2021-12-24
pvck
pvck检测物理卷的LVM元数据的一致性 补充说明pvck命令 用来检测物理卷的LVM元数据的一致性。默认情况下,物理卷中的前4个扇区保存着LVM卷标,可以使用--labelsector选项指定其他的位置(例如:数据恢复时)。 语法1pvck(选项)(参数) 选项123-d:调试模式;-v:详细信息模式;--labelsector:指定LVE卷标所在扇区。 参数物理卷:指定要检查的物理卷对应的设备文件。 实例使用pvck命令检查物理卷/dev/sdb1。在命令行中输入下面的命令: 123456pvck -v /dev/sdb1 #检查物理卷元数据Scanning /dev/sdb1 Found label on /dev/sdb1, sector 1, type=LVM2 001 Found text metadata area: offset=4096, size=192512 Found LVM2 metadata record at offset=125952, size=70656, offset2=0 size2=0
2019-10-24
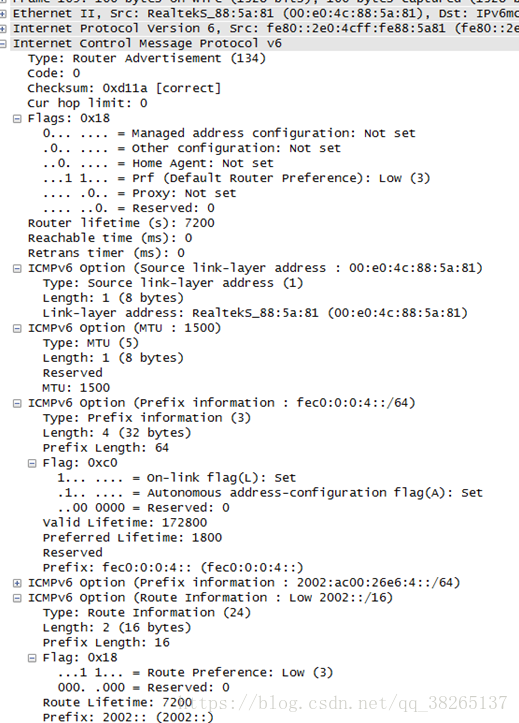
IPv6-NS
邻居发现协议NDP 参考文献 邻居发现协议 0 NDP简介邻居发现协议NDP(Neighbor Discovery Protocol)是IPv6协议体系中一个重要的基础协议。邻居发现协议替代了IPv4的ARP(Address Resolution Protocol)和ICMP路由器发现(Router Discovery),它定义了使用ICMPv6报文实现。 地址自动配置 路由器和路由前缀发现 地址解析 跟踪邻居状态(邻居不可达检测) 重复地址检测 重定向 1 地址自动配置IPv4使用DHCP实现自动配置,包括IP地址,缺省网关等信息,简化了网络管理。IPv6地址增长为128位,且终端节点多,对于自动配置的要求更为迫切,除保留了DHCP作为有状态自动配置外,还增加了无状态自动配置。无状态自动配置即自动生成链路本地地址,主机根据RA报文的前缀信息,自动配置全球单播地址等,并获得其他相关信息。 IPv6主机无状态自动配置过程: 根据接口标识产生链路本地地址。 发出邻居请求,进行重复地址检测。 如地址冲突,则停止自动配置,需要手工配置。 如不冲突,链路本地地址生效,节点具备本...

2021-12-24
firewall-cmd
firewall-cmdLinux上新用的防火墙软件,跟iptables差不多的工具 补充说明firewall-cmd 是 firewalld的字符界面管理工具,firewalld是centos7的一大特性,最大的好处有两个:支持动态更新,不用重启服务;第二个就是加入了防火墙的“zone”概念。 firewalld跟iptables比起来至少有两大好处: firewalld可以动态修改单条规则,而不需要像iptables那样,在修改了规则后必须得全部刷新才可以生效。 firewalld在使用上要比iptables人性化很多,即使不明白“五张表五条链”而且对TCP/IP协议也不理解也可以实现大部分功能。 firewalld自身并不具备防火墙的功能,而是和iptables一样需要通过内核的netfilter来实现,也就是说firewalld和 iptables一样,他们的作用都是用于维护规则,而真正使用规则干活的是内核的netfilter,只不过firewalld和iptables的结 构以及使用方法不一样罢了。 命令格式 1firewall-cmd [选项 ... ...

2020-09-26
boxplot
箱形图中的艺术此示例演示如何使用各种kwargs完全自定义箱形图。第一个图演示了如何删除和添加单个组件(请注意,平均值是默认情况下未显示的唯一值)。第二个图展示了如何定制艺术家的风格。它还演示了如何将胡须的极限设置为特定的百分位数(右下轴) 关于箱形图及其历史的一般参考可以在这里找到:http://vita.had.co.nz/papers/boxplots.pdf 12345678import numpy as npimport matplotlib.pyplot as plt# fake datanp.random.seed(19680801)data = np.random.lognormal(size=(37, 4), mean=1.5, sigma=1.75)labels = list('ABCD')fs = 10 # fontsize 演示如何切换不同元素的显示: 1234567891011121314151617181920212223242526fig, axes = plt.subplots(nrows=2, ncols=3, figsi...


