
date
日期刻度标签
演示如何使用日期刻度定位器和格式化程序在matplotlib中创建日期图。有关控制主要和次要刻度的更多信息,请参阅major_minor_demo1.py
所有matplotlib日期绘图都是通过将日期实例转换为自 0001-01-01 00:00:00 UTC 加上一天后的天数(由于历史原因)来完成的。 转换,刻度定位和格式化是在幕后完成的,因此这对您来说是最透明的。 日期模块提供了几个转换器函数 matplotlib.dates.date2num 和matplotlib.dates.num2date。这些可以在datetime.datetime 对象和 numpy.datetime64 对象之间进行转换。

1 | import numpy as np |
下载这个示例
本博客所有文章除特别声明外,均采用 CC BY-NC-SA 4.0 许可协议。转载请注明来源 Estom的博客!
相关推荐

2020-09-26
quad_bezier
Bezier曲线此示例展示 PathPatch 对象以创建Bezier多曲线路径修补程序。 1234567891011121314151617import matplotlib.path as mpathimport matplotlib.patches as mpatchesimport matplotlib.pyplot as pltPath = mpath.Pathfig, ax = plt.subplots()pp1 = mpatches.PathPatch( Path([(0, 0), (1, 0), (1, 1), (0, 0)], [Path.MOVETO, Path.CURVE3, Path.CURVE3, Path.CLOSEPOLY]), fc="none", transform=ax.transData)ax.add_patch(pp1)ax.plot([0.75], [0.25], "ro")ax.set_title('The red point should be on the...

2020-09-26
demo_constrained_layout
使用约束布局调整轴的大小约束布局尝试调整图中子图的大小,以使轴对象和轴上的标签之间不会重叠。 有关详细信息,请参阅 “约束布局指南”;有关替代方法,请参阅 “严格布局” 指南。 12345678910import matplotlib.pyplot as pltimport itertoolsimport warningsdef example_plot(ax): ax.plot([1, 2]) ax.set_xlabel('x-label', fontsize=12) ax.set_ylabel('y-label', fontsize=12) ax.set_title('Title', fontsize=14) 如果我们不使用constrained_layout,则标签会重叠轴 1234fig, axs = plt.subplots(nrows=2, ncols=2, constrained_layout=False)for ax in axs.flatten(): example_pl...

2021-03-20
45
5.8. 成对的矩阵, 类别和核函数校验者: @FontTian @numpy翻译者: @程威 The sklearn.metrics.pairwise 子模块实现了用于评估成对距离或样本集合之间的联系的实用程序。 本模块同时包含距离度量和核函数,对于这两者这里提供一个简短的总结。 距离度量是形如 d(a, b) 例如 d(a, b) < d(a, c) 如果对象 a 和 b 被认为 “更加相似” 相比于 a 和 c. 两个完全相同的目标的距离是零。最广泛使用的示例就是欧几里得距离。 为了保证是 ‘真实的’ 度量, 其必须满足以下条件: 对于所有的 a 和 b,d(a, b) >= 0 正定性:当且仅当 a = b时,d(a, b) == 0 对称性:d(a, b) == d(b, a) 三角不等式:d(a, c) <= d(a, b) + d(b, c) 核函数是相似度的标准. 如果对象 a 和 b 被认为 “更加相似” 相比对象 a...

2021-05-09
30 快速入门
快速入门目录 快速入门 张量 数据集和数据加载器 转换 建立模型 自动区分 优化循环 保存,加载和使用模型 0 包加载PyTorch有两个处理数据的原语: torch.utils.data.DataLoader和torch.utils.data.Dataset。 Dataset存储样本及其相应的标签,并DataLoader在周围包裹一个可迭代的对象Dataset。 123456import torchfrom torch import nnfrom torch.utils.data import DataLoaderfrom torchvision import datasetsfrom torchvision.transforms import ToTensor, Lambda, Composeimport matplotlib.pyplot as plt 1 数据库和数据导入PyTorch提供了特定领域的库,例如TorchText, TorchVision和TorchAudio,所有这些库都包含数据集。在本教程中,我们将使用TorchVision数据集。 12345678...
2021-04-11
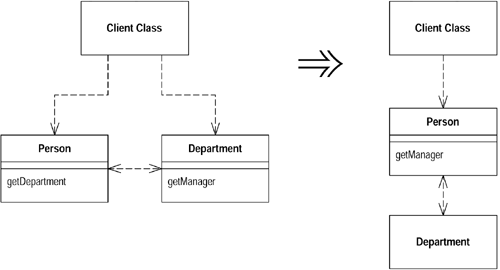
3 在对象之间搬移特性
3 在对象之间搬移特性1 Move Method(搬移函数)如果某个函数使用另一个对象的次数比使用自己所驻对像的次数多,就可以使用Move Method将函数搬移到另一个对象。当函数中用到了原来对象的属性时,搬移后可以把原来对象this作为入参。 重构示例7123456789101112131415161718192021222324252627// 重构前class Account {public: double OverdraftCharge() { if (m_type->IsPremium()) { double result = 10; if (m_dayOverdrawn > 7) { result += (m_dayOverdrawn - 7) * 0.85; } return result; } return m_d...

2020-09-26
whats_new_99_spines
0.99版本新增Spines对象12345678910111213141516171819202122232425262728293031323334353637383940414243444546import matplotlib.pyplot as pltimport numpy as npdef adjust_spines(ax,spines): for loc, spine in ax.spines.items(): if loc in spines: spine.set_position(('outward',10)) # outward by 10 points else: spine.set_color('none') # don't draw spine # turn off ticks where there is no spine if 'left' in spines: ax.yaxis...


