
legend
使用预定义标签的图例
使用图定义图例标签。
1 | import numpy as np |

参考
此示例显示了以下函数、方法、类和模块的使用:
1 | import matplotlib |
下载这个示例
本博客所有文章除特别声明外,均采用 CC BY-NC-SA 4.0 许可协议。转载请注明来源 Estom的博客!
相关推荐

2020-09-26
colormap_reference
Colormap参考Matplotlib附带的色彩映射参考。 通过将 _r 附加到名称(例如,viridis_r),可以获得每个这些颜色映射的反转版本。 请参阅在Matplotlib中选择Colormaps以深入讨论色彩映射,包括colorblind-friendlyliness。 12345678910111213141516171819202122232425262728293031323334353637383940414243444546474849505152535455import numpy as npimport matplotlib.pyplot as pltcmaps = [('Perceptually Uniform Sequential', [ 'viridis', 'plasma', 'inferno', 'magma', 'cividis']), ('Sequential', ...

2020-09-25
5interpolate
定义插值是在直线或曲线上的两点之间找到值的过程。 为了帮助记住它的含义,我们应该将“inter”这个词的第一部分想象为“输入”,表示要查看原来数据的“内部”。 这种插值工具不仅适用于统计学,而且在科学,商业或需要预测两个现有数据点内的值时也很有用。 123456789import numpy as npfrom scipy import interpolateimport matplotlib.pyplot as pltx = np.linspace(0, 4, 12)y = np.cos(x**2/3+4)plt.plot(x, y,’o’)plt.show() 一维插值一维插值scipy.interpolate中的interp1d类是一种创建基于固定数据点的函数的便捷方法,可以使用线性插值在给定数据定义的域内的任意位置评估该函数。通过使用上述数据,创建一个插值函数并绘制一个新的插值图。 12345f1 = interp1d(x, y,kind = 'linear')f2 = interp1d(x, y, kind = 'cubic'
2021-03-13
5 散列表
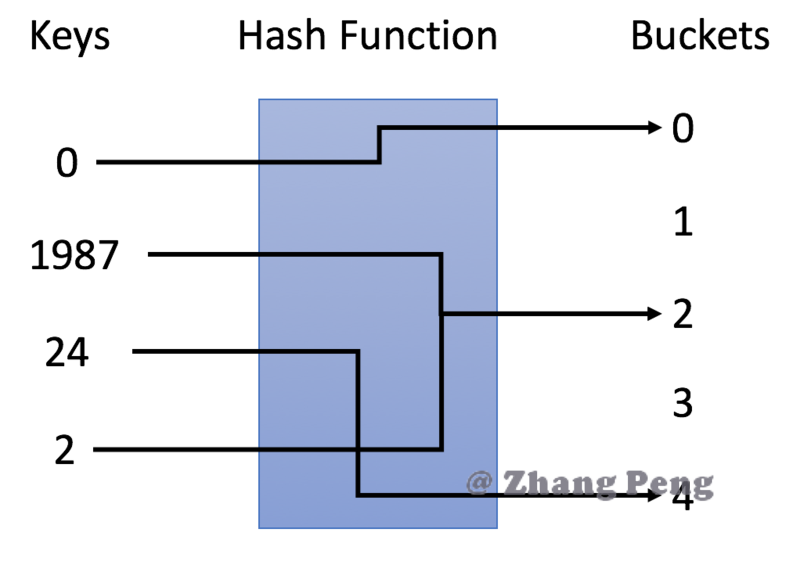
哈希表 包含集合和映射。即unordered_set和unordreed_map两种数据结构的实现方式。 参考文献 https://www.cnblogs.com/gongcheng-/p/10894205.html#_label1_0 1 哈希表简介哈希表的概念 哈希表是一种使用哈希函数组织数据,以支持快速插入和搜索的数据结构。 通过选择合适的哈希函数,哈希表可以在插入和搜索方面实现出色的性能。 哈希表的分类 有两种不同类型的哈希表:哈希集合和哈希映射。 哈希集合是集合set数据结构的实现之一,用于存储非重复值。 哈希映射是映射map 数据结构的实现之一,用于存储(key, value)键值对。 2 哈希表的原理原理说明 哈希表的关键思想是使用哈希函数将键映射到存储桶。更确切地说, 当我们插入一个新的键时,哈希函数将决定该键应该分配到哪个桶中,并将该键存储在相应的桶中; 当我们想要搜索一个键时,哈希表将使用相同的哈希函数来查找对应的桶,并只在特定的桶中进行搜索。 哈希函数 在示例中,我们使用 y = x % 5 作为哈希函数。让我们使用这个例...

2020-09-29
02线性回归
线性回归房价问题 数据集构成 训练集 样本数量m 样本特征$x_i$ 目标变量y 假设函数 假设函数 $$h(x)=\theta_0+\theta_1 x$$ 模型参数$\theta_0,\theta_1$ 代价函数 损失函数、代价函数(loss/cost function):平方误差代价函数 $$J(\theta_0,\theta_1)=\frac{1}{2m}\sum_1^m(h(x_i)-y_i)^2$$ 目标函数:$$minimize_{\theta_0,\theta_1} J(\theta_0,\theta_1)$$ 梯度下降 目标 $$min_{\theta_1,\theta_2,\dots}J(\theta_1,\theta_2,\dots)$$ 给定$\theta$的初始值。不断修改$\theta$的值,使代价函数最小。统计学上使用全局的最小二乘法实现参数估计,计算机科学上使用局部迭代的梯度下降算法实现参数估计。 梯度下降算法的公式 $$\theta_j = \theta_j - \alpha\frac...

2020-09-26
pyplot_scales
Pyplot 比例尺(Scales)在不同的比例上创建图。这里显示了线性,对数,对称对数和对数标度。有关更多示例,请参阅库的“缩放”部分。 12345678910111213141516171819202122232425262728293031323334353637383940414243444546474849505152535455import numpy as npimport matplotlib.pyplot as pltfrom matplotlib.ticker import NullFormatter # useful for `logit` scale# Fixing random state for reproducibilitynp.random.seed(19680801)# make up some data in the interval ]0, 1[y = np.random.normal(loc=0.5, scale=0.4, size=1000)y = y[(y > 0) & (y < 1)]y.sort()x = np...
2021-03-20
a_demo_of_the_spectral_co-clustering_algorithm
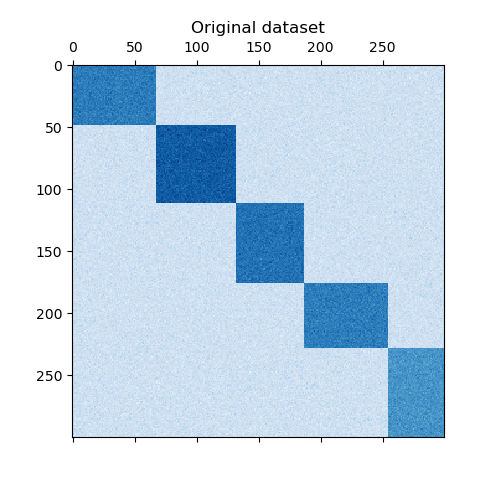
频谱共聚算法演示 翻译者:@N!no校验者:待校验 这个例子演示了如何使用谱协聚类算法生成数据集并对其进行双聚类处理。 数据集是使用 make_biclusters 函数生成的,该函数创建一个小值矩阵,并将大值植入双聚类。然后将行和列打乱并传递给光谱协聚算法。通过重新排列变换后的矩阵可以使双聚类连续,这展示出该算法找到双聚类的准确性。 1consensus score: 1.0 123456789101112131415161718192021222324252627282930313233343536373839404142print(__doc__)# Author: Kemal Eren <kemal@kemaleren.com># License: BSD 3 clauseimport numpy as npfrom matplotlib import pyplot as pltfrom sklearn.datasets import make_biclustersfrom sklearn.cluster import SpectralCoclus...


