
date_demo_rrule
演示日期Rrule
展示如何使用Rrule实例制作自定义日期自动收报机 - 这里我们在每5个复活节放置一个刻度线。
有关Rrules的帮助,请参阅https://dateutil.readthedocs.io/en/stable/

1 | import matplotlib.pyplot as plt |
下载这个示例
本博客所有文章除特别声明外,均采用 CC BY-NC-SA 4.0 许可协议。转载请注明来源 Estom的博客!
相关推荐

2020-09-26
line_with_text
艺术家中的艺术家重写基本方法,以便一个艺术家对象可以包含另一个艺术家对象。在这种情况下,该行包含一个文本实例来为其添加标签。 1234567891011121314151617181920212223242526272829303132333435363738394041424344454647484950515253545556import numpy as npimport matplotlib.pyplot as pltimport matplotlib.lines as linesimport matplotlib.transforms as mtransformsimport matplotlib.text as mtextclass MyLine(lines.Line2D): def __init__(self, *args, **kwargs): # we'll update the position when the line data is set self.text = mtext.Text(0, 0, '...
2021-04-10
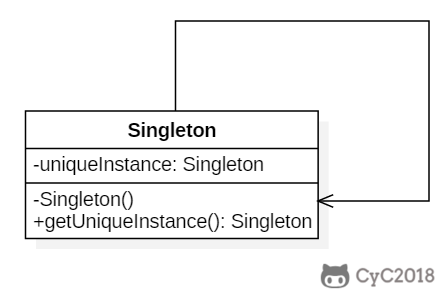
2.1 单例模式
单例模式Singleton1 概念意图保证一个类仅有一个实例,并提供一个访问它的全局访问点。 结构使用一个私有构造函数、一个私有静态变量以及一个公有静态函数来实现。 私有构造函数保证了不能通过构造函数来创建对象实例,只能通过公有静态函数返回唯一的私有静态变量。 参与者Singleton 定义一个 Instance 操作,允许客户访问它的唯一实例。Instance 是一个类操作。 可能负责创建它自己的唯一实例。 适用性在以下情况下可以使用 Singleton 模式: 当类只能有一个实例并且客户可以从一个众所周知的访问点访问它时。 当这个唯一实例应该是通过子类化可扩展的,并且客户应该无需更改代码就能使用一个扩展的实例时。 缺点 系统检查开销。实现中可能每次都需要检查实例是否存在,这个问题可以通过 Static 实例来解决。 系统资源开销。通常 Singleton 中的对象一旦被创建,不会被及时销毁。可以通过提供 Reset 操作来重置。 引起开发混淆。如果类包括 public 构造函数可以在外部构造,当使用 Singleton 对象时,开发人员需要记住不能使用...

2020-09-26
set_and_get
设置和获取pylot接口允许您使用setp和getp来设置和获取对象属性,以及对象进行内省。 设置要将线条的线型设置为虚线,您可以执行以下操作: 12>>> line, = plt.plot([1,2,3])>>> plt.setp(line, linestyle='--') 如果要了解有效的参数类型,可以提供要设置的属性的名称而不使用值: 12>>> plt.setp(line, 'linestyle') linestyle: [ '-' | '--' | '-.' | ':' | 'steps' | 'None' ] 如果要查看可以设置的所有属性及其可能的值,您可以执行以下操作: 1>>> plt.setp(line) set在单个实例或实例列表上运行。如果您处于查询模式内省可能的值,则仅使用序列中的第一个实例。实际设置值时,全部实例将...

2021-12-24
repquota
repquota报表的格式输出磁盘空间限制的状态 补充说明repquota命令 以报表的格式输出指定分区,或者文件系统的磁盘配额信息。 语法1repquota(选项)(参数) 选项1234-a:列出在/etc/fstab文件里,有加入quota设置的分区的使用状况,包括用户和群组;-g:列出所有群组的磁盘空间限制;-u:列出所有用户的磁盘空间限制;-v:显示该用户或群组的所有空间限制。 参数文件系统:要打印报表的文件系统或者对应的设备文件名。 实例显示所有文件系统的磁盘使用情况 1repquota -a

2021-03-09
2 创建型设计模式
Creational Patterns(创建型模式)1 概述目标创建型模式(Creational Patterns)抽象了对象实例化过程。 用于 创建、组合和表示 一个系统的所有对象。 一个类创建型模式使用继承改变被实例化的类。 一个对象创建型模式将实例化委托给另一个对象。 随着系统演化得越来越依赖于对象复合而不是类的继承,创建型模式变得更为重要。 在这些模式中,有两个不断出现的主旋律: 它们都将关于该系统使用那些具体的类的信息封装起来。 它们隐藏了这些类的实例是如何被创建和放在一起的。 因此,创建型模式在什么被创建,谁创建它,它是怎样被创建的,以及何时创建这些方面给予你很大的灵活性。 Consequently, the creational patterns give you a lot of flexibility in what gets created, who creates it, how it gets created, and when. 2 具体方法Factory Method (工厂方法) Define an interface for creat...

2025-09-03
03 数据结构
结构体结构体定义结构体和我们在“元组类型”章节论过的元组类似。和元组一样,结构体的每一部分可以是不同类型。但不同于元组,结构体需要命名各部分数据以便能清楚的表明其值的意义。由于有了这些名字,结构体比元组更灵活:不需要依赖顺序来指定或访问实例中的值。 定义结构体,需要使用 struct 关键字并为整个结构体提供一个名字。结构体的名字需要描述它所组合的数据的意义。接着,在大括号中,定义每一部分数据的名字和类型,我们称为 字段(field)。例如,示例 5-1 展示了一个存储用户账号信息的结构体: 12345678struct User { active: bool, username: String, email: String, sign_in_count: u64,}fn main() {} 结构体使用通过为每个字段指定具体值的方式来创建该结构体的实例。创建一个实例需要以结构体的名字开头,接着在大括号中使用 key: value 键-值对的形式提供字段,其中 key 是字段的名字,value 是需要存储在字段中的数...


