
date_index_formatter2
日期索引格式化程序
在绘制每日数据时,频繁的请求是绘制忽略跳过的数据,例如,周末没有额外的空格。这在金融时间序列中尤为常见,因为您可能拥有M-F而非Sat,Sun的数据,并且您不需要x轴上的间隙。方法是简单地使用xdata的整数索引和自定义刻度Formatter来获取给定索引的适当日期字符串。

输出:
1 | loading /home/tcaswell/mc3/envs/dd37/lib/python3.7/site-packages/matplotlib/mpl-data/sample_data/msft.csv |
1 | import numpy as np |
下载这个示例
https://estom.github.io/2020/09/26/Python/matplotlab/gallery/ticks_and_spines/date_index_formatter2/
本博客所有文章除特别声明外,均采用 CC BY-NC-SA 4.0 许可协议。转载请注明来源 Estom的博客!
相关推荐

2021-12-24
finger
finger用于查找并显示用户信息 补充说明finger命令 用于查找并显示用户信息。包括本地与远端主机的用户皆可,帐号名称没有大小写的差别。单独执行finger指令,它会显示本地主机现在所有的用户的登陆信息,包括帐号名称,真实姓名,登入终端机,闲置时间,登入时间以及地址和电话。 语法1finger(选项)(参数) 选项1234-l:列出该用户的帐号名称,真实姓名,用户专属目录,登入所用的Shell,登入时间,转信地址,电子邮件状态,还有计划文件和方案文件内容;-m:排除查找用户的真实姓名;-s:列出该用户的帐号名称,真实姓名,登入终端机,闲置时间,登入时间以及地址和电话;-p:列出该用户的帐号名称,真实姓名,用户专属目录,登入所用的Shell,登入时间,转信地址,电子邮件状态,但不显示该用户的计划文件和方案文件内容。 不指定finger的选项如果提供操作者的话,缺省设为-l输出风格,否则为-s风格,注意在两种格式中,如果信息不足,都有一些域可能丢失,如果没有指定参数finger会为当前登录的每个用户打印一个条目。 参数用户名:指定要查询信息的用户。 实例在计算机上使用fin...

2021-04-14
19 内存对齐
概述概念 编译器为程序中的每个“数据单元”安排在适当的位置上。 原因 平台原因(移植原因):不是所有的硬件平台都能访问任意地址上的任意数据的;某些硬件平台只能在某些地址处取某些特定类型的数据,否则抛出硬件异常。 性能原因:数据结构(尤其是栈)应该尽可能地在自然边界上对齐。原因在于,为了访问未对齐的内存,处理器需要作两次内存访问;而对齐的内存访问仅需要一次访问。 补充观点:字节对齐主要是为了提高内存的访问效率,比如intel 32位cpu,每个总线周期都是从偶地址开始读取32位的内存数据,如果数据存放地址不是从偶数开始,则可能出现需要两个总线周期才能读取到想要的数据,因此需要在内存中存放数据时进行对齐。 例如64位操作系统,存储32位int值。如果两个int值占用同一个64位的寻址空间,那么方位第二个int值,需要两次寻址过程。首先找到地址,然后得到偏移。 规则每个特定平台上的编译器都有自己的默认“对齐系数”(也叫对齐模数)。程序员可以通过预编译命令#pragma pack(n),n=1,2,4,8,16来改变这一系数,其中的n就是你要指定的“对齐系数”。 数据成员...

2021-08-01
《呼吸》
《商人和炼金术师之门》也许因为在做“科幻世界的电话”主题的分享,感觉电话与门有异曲同工之妙。主人公讲述了三位商人与一个炼金术师巴沙拉特的门的故事。 巴沙拉特展示了一种可以在过去和未来之间穿梭的神奇的年门,通过一个金属环的穿梭实验,展示了从一端到另一端会存在时间差。 第一个故事中,一个叫哈桑的绳匠,在二十年后的自己的指引下,躲过劫难,发现了一箱金子,然后发财,在二十年后成为了一个富豪。“仗势未来,横行现在的人,也许在第一次使用你年门的饿时候,就会发现他年长的自己早已亡故”。“忏悔和赎罪可以抹掉过去的罪孽”。“未来也是一样的,在这方面,它和过去没有区别”。故事没有着眼于未来与现在的矛盾,到底是先挖出箱子还是未来的人先知道箱子就在那里,无从得知。 第二个故事中,一个叫阿吉布的织工,发现二十年后的自己依旧穷困潦倒,却在床头存有一箱金币。于是从二十年后自己那里偷走了一箱金币,因此与爱慕的女人生活在一起,但是妻子却被强盗掳走,金币全都做了赎金。于是他开始一点点攒着金币,放在床头的箱子里,等着有朝一日,年轻的自己来偷走攒下的金币。同样他的妻子也回到过去,教会了他未来才掌握的、展示给妻子的东西。...
2020-10-14
序列模型和注意力机制
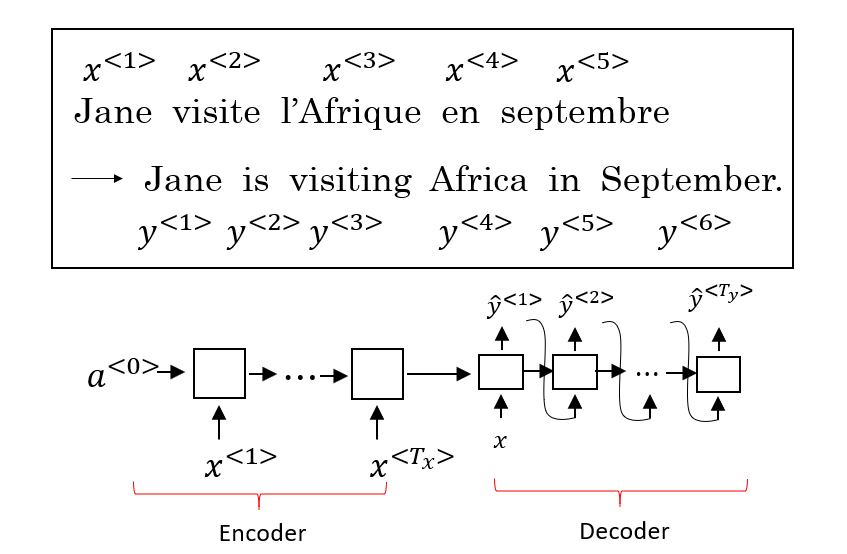
序列模型和注意力机制Seq2Seq 模型 Seq2Seq(Sequence-to-Sequence) 模型能够应用于机器翻译、语音识别等各种序列到序列的转换问题。一个 Seq2Seq 模型包含 编码器(Encoder) 和 解码器(Decoder) 两部分,它们通常是两个不同的 RNN。如下图所示,将编码器的输出作为解码器的输入,由解码器负责输出正确的翻译结果。 提出 Seq2Seq 模型的相关论文: Sutskever et al., 2014. Sequence to sequence learning with neural networks Cho et al., 2014. Learning phrase representaions using RNN encoder-decoder for statistical machine translation 这种编码器-解码器的结构也可以用于图像描述(Image captioning)。将 AlexNet 作为编码器,最后一层的 Softmax 换成一个 RNN 作为解码器,网络的输出序列就是对图像的一个描...

2020-10-13
24_Transfer Learning
Transfer Learning 迁移学习,主要介绍共享layer的方法以及属性降维对比的方法 Introduction迁移学习,transfer learning,旨在利用一些不直接相关的数据对完成目标任务做出贡献 not directly related以猫狗识别为例,解释“不直接相关”的含义: input domain是类似的,但task是无关的 比如输入都是动物的图像,但这些data是属于另一组有关大象和老虎识别的task input domain是不同的,但task是一样的 比如task同样是做猫狗识别,但输入的是卡通类型的图像 compare with real life事实上,我们在日常生活中经常会使用迁移学习,比如我们会把漫画家的生活自动迁移类比到研究生的生活 overview迁移学习是很多方法的集合,这里介绍一些概念: Target Data:和task直接相关的data Source Data:和task没有直接关系的data 按照labeled data和unlabeled data又可以划分为四种: Case 1这里ta...
2021-03-20
18
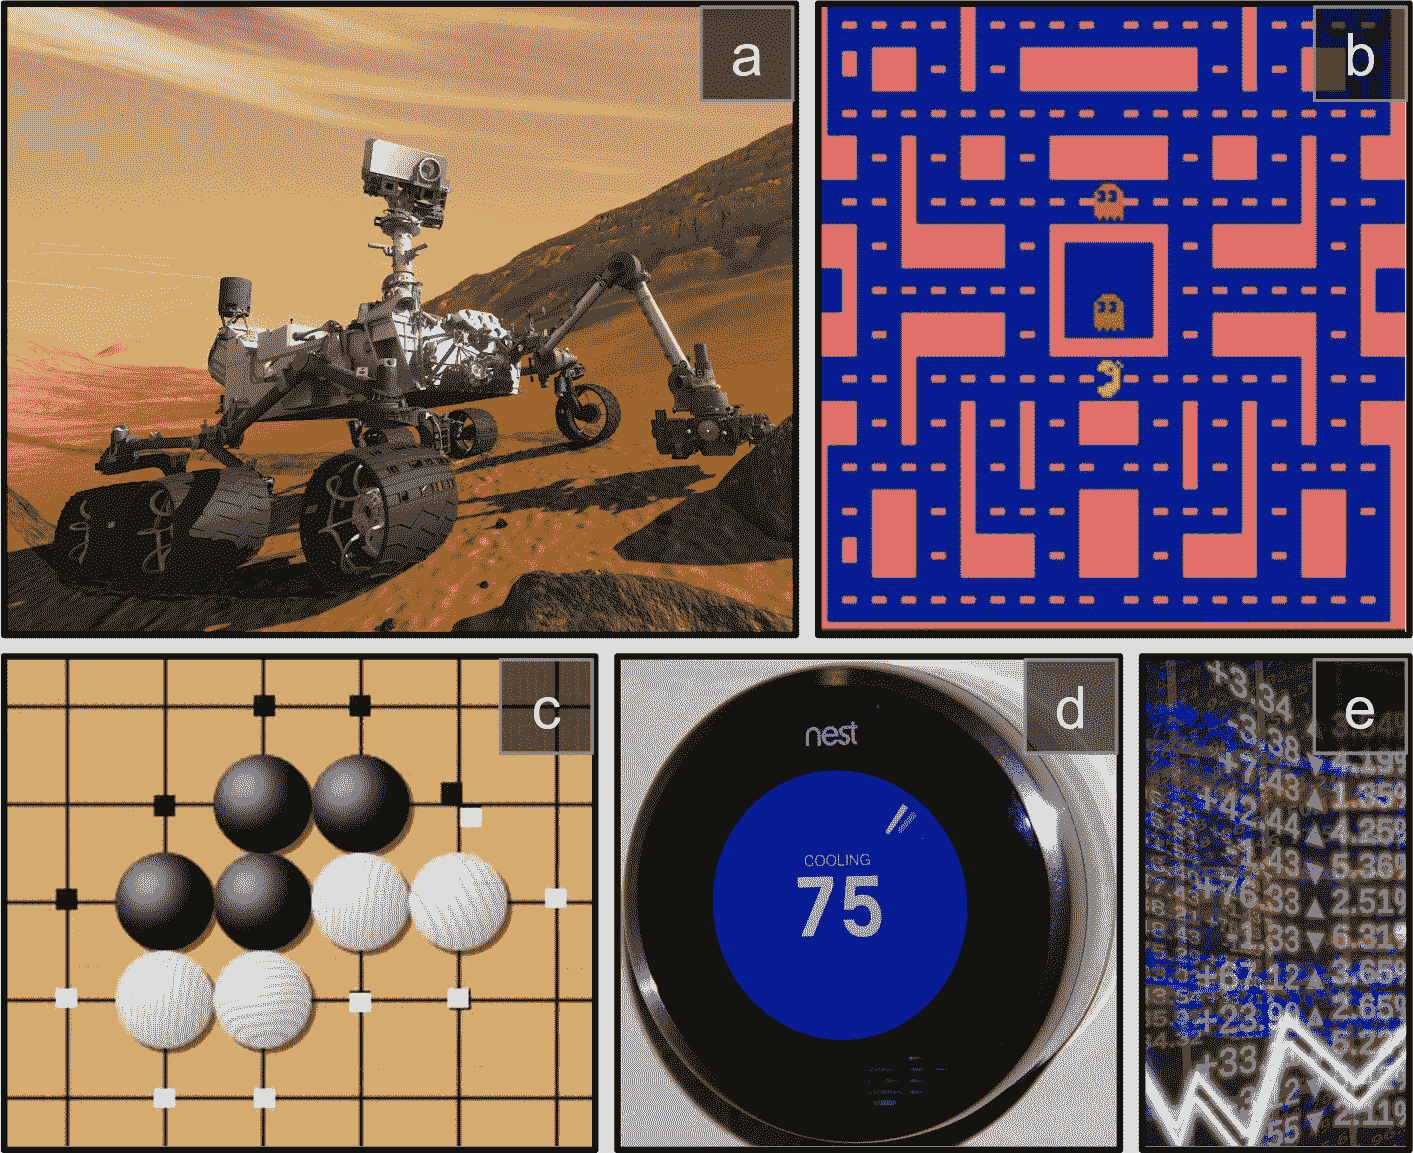
十八、强化学习 译者:@SeanCheney 强化学习(RL)如今是机器学习的一大令人激动的领域,也是最老的领域之一。自从 1950 年被发明出来后,它被用于一些有趣的应用,尤其是在游戏(例如 TD-Gammon,一个西洋双陆棋程序)和机器控制领域,但是从未弄出什么大新闻。直到 2013 年一个革命性的发展:来自英国的研究者发起了 Deepmind 项目,这个项目可以学习去玩任何从头开始的 Atari 游戏,在多数游戏中,比人类玩的还好,它仅使用像素作为输入而没有使用游戏规则的任何先验知识。这是一系列令人惊叹的壮举中的第一个,并在 2016 年 3 月以他们的系统 AlphaGo 战胜了世界围棋冠军李世石而告终。从未有程序能勉强打败这个游戏的大师,更不用说世界冠军了。今天,RL 的整个领域正在沸腾着新的想法,其都具有广泛的应用范围。DeepMind 在 2014 被谷歌以超过 5 亿美元收购。 DeepMind 是怎么做到的呢?事后看来,原理似乎相当简单:他们将深度学习运用到强化学习领域,结果却超越了他们最疯狂的设想。在本章中,我们将首先解释强化学习是什么,以及它擅长于什么,然...


