
scalarformatter
使用ScalarFormat标记格式
该示例显示了ScalarFormatter与不同设置的使用。
例子1:默认
例子2:没有图形偏移
例子3:使用Mathtext
1 | import matplotlib.pyplot as plt |
例子1:
1 | x = np.arange(0, 1, .01) |

例子2:
1 | x = np.arange(0, 1, .01) |

例子3:
1 | x = np.arange(0, 1, .01) |

下载这个示例
本博客所有文章除特别声明外,均采用 CC BY-NC-SA 4.0 许可协议。转载请注明来源 Estom的博客!
相关推荐

2021-12-24
pvck
pvck检测物理卷的LVM元数据的一致性 补充说明pvck命令 用来检测物理卷的LVM元数据的一致性。默认情况下,物理卷中的前4个扇区保存着LVM卷标,可以使用--labelsector选项指定其他的位置(例如:数据恢复时)。 语法1pvck(选项)(参数) 选项123-d:调试模式;-v:详细信息模式;--labelsector:指定LVE卷标所在扇区。 参数物理卷:指定要检查的物理卷对应的设备文件。 实例使用pvck命令检查物理卷/dev/sdb1。在命令行中输入下面的命令: 123456pvck -v /dev/sdb1 #检查物理卷元数据Scanning /dev/sdb1 Found label on /dev/sdb1, sector 1, type=LVM2 001 Found text metadata area: offset=4096, size=192512 Found LVM2 metadata record at offset=125952, size=70656, offset2=0 size2=0

2020-09-26
colorbar_tick_labelling_demo
颜色栏刻度标签演示为彩条生成自定义标签。 供稿人:Scott Sinclair 1234import matplotlib.pyplot as pltimport numpy as npfrom matplotlib import cmfrom numpy.random import randn 使用垂直(默认)颜色条创建绘图 12345678910fig, ax = plt.subplots()data = np.clip(randn(250, 250), -1, 1)cax = ax.imshow(data, interpolation='nearest', cmap=cm.coolwarm)ax.set_title('Gaussian noise with vertical colorbar')# Add colorbar, make sure to specify tick locations to match desired ticklabelscbar = fig.colorbar(cax, ticks=[-1, 0, 1])...

2020-09-26
unicode_minus
Unicode 负表示您可以使用正确的排版Unicode 负号或ASCII连字符表示负好,有些开发者倾向于这样做。 rcParams[“axes.unicode_minus”]控制默认行为。 默认是使用Unicode负号。 12345678910111213import numpy as npimport matplotlibimport matplotlib.pyplot as plt# Fixing random state for reproducibilitynp.random.seed(19680801)matplotlib.rcParams['axes.unicode_minus'] = Falsefig, ax = plt.subplots()ax.plot(10*np.random.randn(100), 10*np.random.randn(100), 'o')ax.set_title('Using hyphen instead of Unicode minus')plt.show() 下载这个示...
2020-09-27
2.k-近邻算法
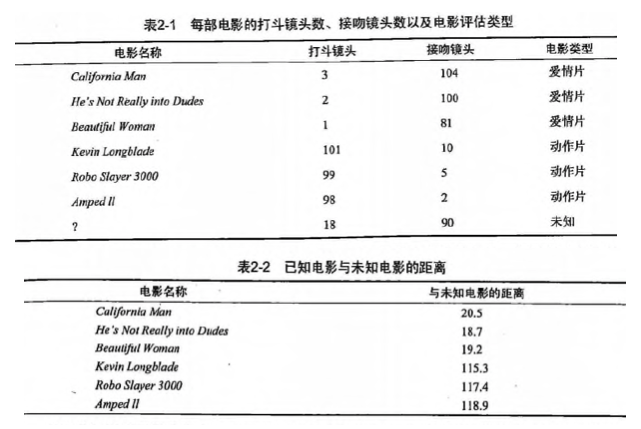
第2章 k-近邻算法1 KNN 概述k-近邻(kNN, k-NearestNeighbor)算法是一种基本分类与回归方法,我们这里只讨论分类问题中的 k-近邻算法。一句话总结: 近朱者赤近墨者黑! k 近邻算法的输入为实例的特征向量,对应于特征空间的点;输出为实例的类别,可以取多类。k 近邻算法假设给定一个训练数据集,其中的实例类别已定。分类时,对新的实例,根据其 k 个最近邻的训练实例的类别,通过多数表决等方式进行预测。因此,**k近邻算法不具有显式的学习过程**。 k 近邻算法实际上利用训练数据集对特征向量空间进行划分,并作为其分类的“模型”。 **k值的选择、距离度量以及分类决策规则**是k近邻算法的三个基本要素。 2 KNN 场景 电影可以按照题材分类,那么如何区分 动作片 和 爱情片 呢? 动作片: 打斗次数更多 爱情片: 亲吻次数更多 基于电影中的亲吻、打斗出现的次数,使用 k-近邻算法构造程序,就可以自动划分电影的题材类型。 现在根据上面我们得到的样本集中所有电影与未知电影的距离,按照距离递增排序,可以找到 k 个距离最近的电影。 假定 k=...

2020-09-26
contourf_hatching
Contourf 影线法演示填充轮廓图形与阴影模式。 1234567891011import matplotlib.pyplot as pltimport numpy as np# invent some numbers, turning the x and y arrays into simple# 2d arrays, which make combining them together easier.x = np.linspace(-3, 5, 150).reshape(1, -1)y = np.linspace(-3, 5, 120).reshape(-1, 1)z = np.cos(x) + np.sin(y)# we no longer need x and y to be 2 dimensional, so flatten them.x, y = x.flatten(), y.flatten() 图1:最简单的带彩色条的阴影图 1234fig1, ax1 = plt.subplots()cs = ax1.contourf(x, y, z, hatches=[&#x...

2021-12-24
who
who显示当前所有登陆用户的信息。 概要1who [OPTION]... [file] [am i] 主要用途 当没有给出非选项参数时,按以下字段顺序为每个当前用户打印信息:登录用户名称,终端信息,登录时间,远程主机或X display。 当用户执行 who am i 时,只显示运行该命令的用户的信息。 选项123456789101112131415161718192021-a, --all 等价于调用 '-b -d --login -p -r -t -T -u'。-b, --boot 上次系统启动的时间。-d, --dead 打印 dead 状态的进程。-H, --heading 打印列标题行。-l, --login 打印系统登录进程。--lookup ...


